



Most cleaning companies can tell you their monthly revenue down to the dollar. Ask them which jobs are losing money, and the room goes quiet. They know the total looks fine, so they assume every part of it is fine too. That assumption is exactly where the profit leaks live.
Revenue hides everything. A $180 deep clean that took an extra crew member and 40 minutes of unpaid drive time can sit right next to a clean $140 recurring visit in your bank statement and they look identical. The problem isn't that owners are bad at math. It's that the numbers that matter — the ones tied to a specific job or a specific route — are scattered across a booking calendar, a payroll app, a receipt pile, and someone's memory.
A cleaning business unit economics dashboard is just the discipline of pulling all of that into one view: what you charged, what it actually cost to deliver, and what you kept. Once you can see it per job and per route, decisions that used to feel like gut calls become pretty obvious.
Why the leaks stay invisible
There's a pattern that shows up constantly. A company grows to maybe six or eight cleaners, revenue is climbing, and the owner feels busier but not richer. They add clients, they add crew, and margins quietly compress. Nothing dramatic breaks — it's just a slow bleed.
-
Bookings live in your scheduling tool and tell you price and duration — but only the scheduled duration.
-
Actual labor time lives in your time-tracking app or, worse, whatever the crew wrote down.
-
Supplies get bought in bulk, so nobody's allocating them back to individual jobs.
-
Travel almost never gets counted at all, even though it's paid time and fuel.
-
Payroll shows up two weeks later as one big number with no job-level breakdown.
Each of these is its own silo. Any single one looks fine in isolation. It's only when you stitch them together per job that the ugly ones show up. A job can be profitable on paper — good price, reasonable scheduled hours — and a loser in reality: crew ran 45 minutes over, drove across town, used extra product on a neglected bathroom.
The insight most owners miss: your averages are lying to you. A healthy 28% average margin can easily be a blend of jobs running at 45% and jobs running at negative 10%. Averages let the losers hide behind the winners. Unit economics is just the act of pulling them apart.
What breaks as you scale
When you're a solo operator, you are the dashboard. You know the drive was long, you remember the client's dog wrecked the schedule, you feel it when a job runs over. That intuition is real data — it just doesn't survive delegation.
Never miss a cleaning appointment again.
Maidufy helps you book, confirm, and manage every cleaning service seamlessly.
- Centralized booking management
- Automated client reminders
- Optimized staff scheduling
No credit card required
The moment you hand jobs to crews, that felt knowledge disappears. Now you've got three teams running routes you're not on, and the only signal you get back is a paycheck and a client complaint. We covered this transition in more detail in the piece on how growth stalls after the solo operator stage, and unit economics is one of the first things that quietly falls apart in that jump.
-
Scheduled time stops matching actual time. When you were doing the job, scheduled and actual were basically the same. With crews, a job booked for 2 hours might reliably run 2.5 — and if you're pricing off the booked number, you're eating that gap every single visit.
-
Travel becomes a real cost center. One person driving to five nearby homes is efficient. Three crews criss-crossing a metro because nobody batched geographically is a margin killer that never appears on any invoice. This compounds directly with what's covered in the piece on underquoting deep cleans — bad pricing and travel waste together are brutal.
-
Supply costs drift with no owner watching. Solo, you notice when you're buying product faster than usual. With crews, consumption just happens. Nobody's tying a jug of floor cleaner back to the job that used it, so waste is invisible.
Unit economics isn't a spreadsheet you build once. It's the reporting layer that replaces the owner's intuition once the owner can no longer be everywhere. If you don't build it, you're flying blind exactly when the stakes get higher.
The five inputs and how to allocate them
Everything in a job's real cost comes down to five buckets. The hard part is allocation — deciding how to fairly assign shared costs (like a bulk supply order or a salaried manager) down to individual jobs. Here's a set of allocation rules that hold up in practice without turning into a full-time accounting job.
| Input | Where it lives | Allocation rule |
|---|---|---|
| Revenue | Booking / invoice | Direct — actual amount charged, minus discounts and refunds |
| Direct labor | Time tracking | Actual clock-in to clock-out × loaded wage (wage + taxes + comp, usually 1.25–1.4× base) |
| Travel | Route data / timesheets | Paid drive time × loaded wage + estimated fuel (miles × per-mile rate) |
| Supplies | Purchase records | Per-visit consumable rate (a flat $4–$9 per standard clean works better than trying to track every spray) |
| Overhead | Fixed monthly costs | Allocated per labor hour (total monthly overhead ÷ total billable hours) |
A couple of things worth flagging here.
Use a loaded wage, not the hourly rate. If you pay a cleaner $20/hour and only count $20, you're understating labor by 25–40% once you add payroll taxes, workers' comp, and any benefits. A job that looks like it has a 30% margin on raw wages might have 15% on loaded wages. That gap is where owners fool themselves most often.
Use a loaded wage when allocating labor so job margins aren't overstated.
Don't over-engineer supplies. Some owners try to track every microfiber cloth. Not worth it. A per-visit blended rate you review quarterly is accurate enough to make decisions and simple enough to actually maintain.
Overhead per labor hour is the underrated one. Your insurance, software, admin salary, and vehicle costs don't disappear on a slow week — they just get spread over fewer hours, which quietly raises the true cost of every job. Watching overhead-per-hour tells you when you've got capacity you're not selling.
The KPIs that actually earn their place on the dashboard
You don't need thirty metrics. You need the handful that change a decision.
-
Job margin % — Revenue minus all five cost buckets, per job. The headline number. Sort your job list by this and the losers surface instantly.
-
Effective hourly rate — Revenue ÷ total hours (clean time + travel). This exposes low-price, high-travel jobs that look fine until you run this number.
-
Revenue per crew-hour — How much billable revenue each paid crew hour generates. Your best lever for capacity decisions.
-
Route margin % — All jobs on a route, netted together with shared travel. A route can carry one weak job if the cluster is tight enough.
-
Schedule variance — Actual time ÷ scheduled time. Anything consistently over 1.15 means your pricing or your booking durations are off.
-
Overhead absorption — Are your billable hours high enough to cover fixed costs comfortably? When this slips, growth is masking a shrinking cushion.
The mistake with KPI dashboards: owners track availability metrics (how many jobs, total revenue) instead of efficiency metrics. Total revenue feels good. Effective hourly rate tells the truth. If you only put one new number in front of yourself this quarter, make it effective hourly rate including travel.
What the dashboard should actually look like
Forget fancy visualizations. An owner-ready dashboard is three simple screens.
Screen 1 — Job Profitability (the sortable table)
| JOB | CHARGED | LABOR | TRAVEL | SUPPLY | OH | MARGIN$ | MARGIN% |
|---|---|---|---|---|---|---|---|
| Maple St (recurring) | $145 | $58 | $9 | $6 | $22 | $50 | 34% |
| Oak Ave (deep clean) | $290 | $164 | $22 | $12 | $48 | $44 | 15% |
| Downtown condo | $120 | $61 | $28 | $6 | $22 | $3 | 2% ⚠ |
| Riverside (recurring) | $160 | $60 | $7 | $6 | $22 | $65 | 41% |
The moment this table exists, the Downtown condo screams at you. Two percent margin — and look why. $28 of travel on a $120 job. That's not a pricing problem, it's a routing problem, and you can only see it because travel is broken out as its own line.
| ROUTE | JOBS | REVENUE | TOTAL COST | MARGIN% | MILES | REV/CREW-HR |
|---|---|---|---|---|---|---|
| North cluster | 5 | $780 | $520 | 33% | 22 | $61 |
| West scatter | 4 | $560 | $470 | 16% | 58 | $44 ⚠ |
The West route isn't a bad set of clients — it's a badly batched set of clients. 58 miles for four jobs. Either tighten it geographically or reprice for the travel.
Screen 3 — Weekly Trend A simple line for effective hourly rate and overhead absorption week over week. You're not watching for a single number, you're watching for drift. Margins rarely collapse in one week — they slide over two months while revenue keeps climbing and hides it.
Here's a simple visual workflow to keep the cadence visible.
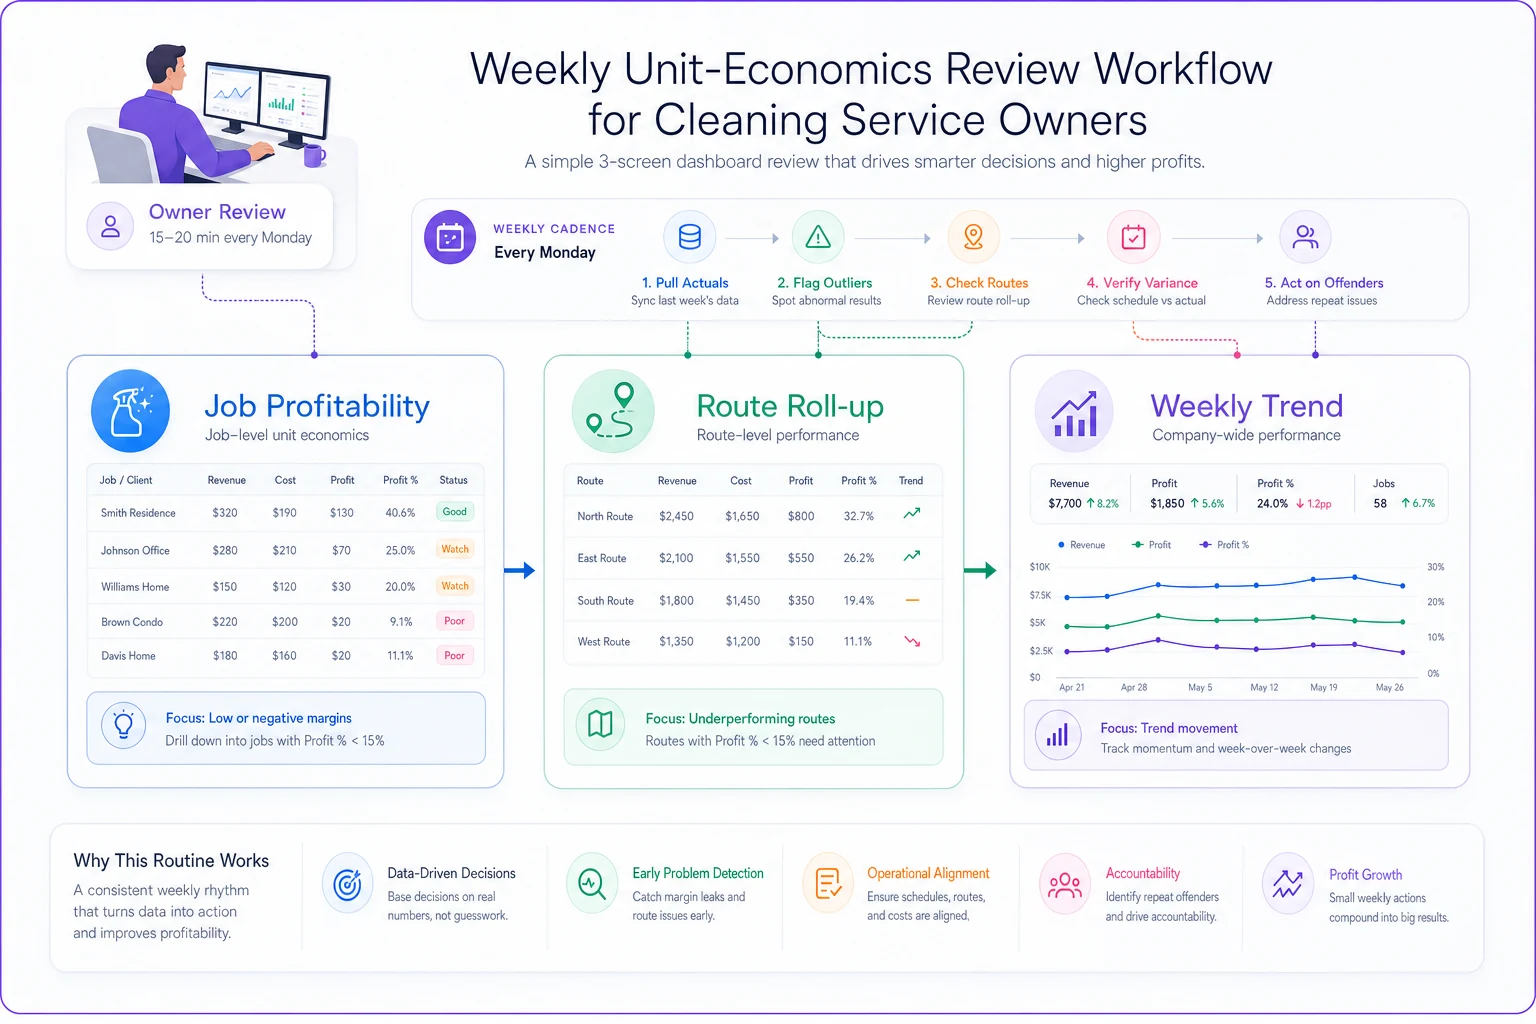
Use the three screens together to surface the jobs and routes that are leaking profit and to guide your weekly actions.
The weekly reporting cadence you can copy
A dashboard nobody looks at is worse than no dashboard, because it creates false confidence. The value is in the rhythm. Here's a cadence that takes about 30 minutes a week once it's running.
-
Monday, 15 min — Pull last week's actuals. Import clock times, mileage, and any supply orders. Match them to completed jobs. This step has to be nearly automatic, or it won't happen.
-
Monday, 5 min — Flag the bottom five. Sort by job margin, look at your five worst jobs. Ask one question each: pricing, time overrun, or travel?
-
Monday, 5 min — Check route roll-ups. Any route under roughly 20% margin gets a note.
-
Wednesday, 5 min — Compare to schedule variance. Which jobs are consistently running long? Those are your next repricing conversations.
-
End of month — Reprice or re-route the repeat offenders. A job that shows up in your bottom five three weeks running isn't a fluke. Fix it or fire it.
The pattern that makes this work: you're not reviewing everything, you're reviewing the exceptions. Ninety percent of your jobs are probably fine. The discipline is in consistently catching the 10% that leak, before they've been leaking for a full quarter.
This cycle — pull actuals, flag outliers, check routes, verify time variance, act on repeat offenders — is the core loop. It sounds simple because it is. The hard part is doing it every week even when revenue looks fine.
A real scenario
A maid agency running around 330 monthly visits with four crews. Revenue was steady, roughly $46k–$49k a month, but the owner's take-home had been flat for over a year despite adding clients. Classic slow bleed.
When they finally broke jobs out by true cost, two things fell out immediately. First, about a fifth of their recurring clients — mostly older bookings that had never been repriced — were running at single-digit margins because scheduled times hadn't kept up with how long the jobs actually took. Schedule variance on those was running 1.2 to 1.3. Second, one entire route was scattered badly enough that travel was eating close to a fifth of the revenue on it.
Nothing exotic in the fix. They repriced the underwater recurring clients (lost two, which was fine — those were the losers anyway), rebooked their durations to match reality, and re-clustered the scattered route over about six weeks. Nobody worked harder. The job mix just got cleaner. Owner take-home moved up by roughly $2,600–$3,000 a month within the quarter, almost entirely from stopping the leaks rather than adding revenue.
The lesson wasn't "raise prices." It was that you can't fix what you can't see per job.
Where software fits — and where it doesn't
You can build the first version of this in a spreadsheet, and honestly you probably should, because it forces you to understand your own allocation rules before you automate anything. The spreadsheet breaks down at one specific point: data collection. The whole system depends on actual clock times, actual mileage, and job-linked supply costs flowing in every week without someone manually re-typing them. That manual step is where every DIY dashboard dies around the two-month mark.
This is where operational platforms that connect scheduling, field time-tracking, and route data actually earn their keep — not because of anything fancy, but because they close the gap between scheduled and actual automatically. When clock-in/out from the field ties directly to the booking and mileage comes off the route rather than a guess, the dashboard populates itself and Monday becomes a glance instead of an hour of data entry. AI-assisted platforms can also flag outlier jobs automatically — the ones running well over scheduled time — so instead of sorting through a whole table, you're just reviewing what got surfaced.
The tool matters less than the habit. But be honest with yourself: if the numbers require manual assembly every week, it won't last more than a few weeks, and then you're back to flying blind.
When this is worth building — and when it isn't
Build it now if: you've got crews running jobs you're not on, you've grown revenue but not profit, or you genuinely can't name your three least profitable jobs. Those are all signs the leaks are already active.
It's overkill if: you're a true solo operator doing every job yourself. Your intuition is still the dashboard, and the tracking overhead won't pay for itself yet. Build the habit of thinking in unit costs now, but don't build the machinery until you're delegating.
Skip the fancy version if: you don't yet have clean time-tracking. There's no point computing job margins off guessed hours — you'll make confident decisions on bad data, which is worse than having no dashboard at all. Fix field time capture first, then build this on top of it.
Profit leaks in a cleaning business almost never announce themselves. Revenue grows, you feel busy, and the losers hide behind the winners in your bank balance for months. The whole point of pulling bookings, time, supplies, travel, and payroll into a single per-job view isn't to add reporting for its own sake — it's to give yourself back the visibility you had when you were doing every job personally. Build that view, look at it every Monday, and act on the bottom five. That's really the whole game.
Ready to elevate your cleaning business?
Join 500+ cleaning services using Maidufy to save time, reduce scheduling errors, and deliver exceptional client satisfaction.