

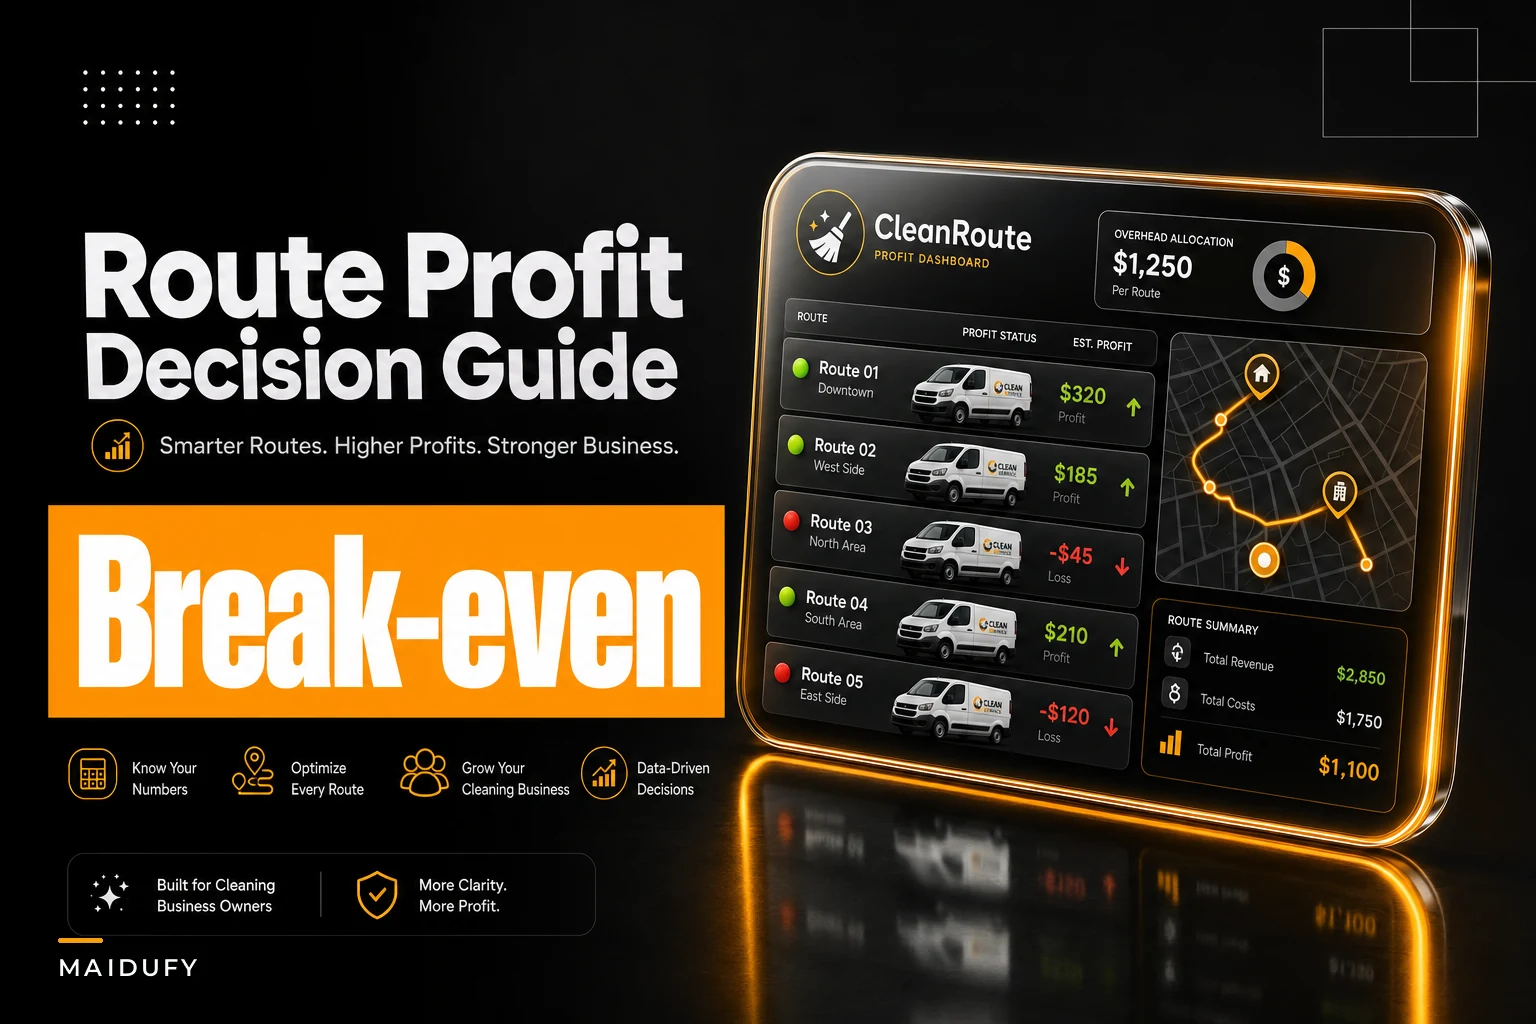

Your Tuesday route in Riverside feels busy. Three regular customers, decent density, crews finish by 4 PM most weeks. But when you factor in drive time from your base in downtown, vehicle costs, and the fact that you're sending a full crew for just three houses, that route actually loses $280 every Tuesday.
Route profitability in a cleaning business isn't just revenue minus wages. The real calculation involves fixed costs spread across routes, variable costs that shift with distance and density, and demand thresholds that determine whether a territory can actually support profitable operations. Most cleaning companies never run these numbers until they're already bleeding.
The allocation problem nobody teaches you
Traditional accounting lumps all your costs together and divides by total revenue. That tells you whether the business makes money overall, but completely misses which routes are quietly draining profit and which ones are subsidizing the losers.
Fixed costs need allocation rules. Your insurance costs $800 a month whether you run one route or ten. Your office manager's salary stays the same. Software subscriptions don't change. But how much of that $800 belongs to your Wednesday northside route versus your Friday downtown route?
The practical method is proportional allocation based on route revenue. If Wednesday northside generates 22% of weekly revenue, it carries 22% of fixed costs. Simple enough to calculate, but most operators never think to separate costs this way.
Variable costs track differently. Gas, vehicle wear, cleaning supplies, and labor hours all change based on route characteristics. A spread-out suburban route might burn $45 in gas while a dense downtown route uses $12. Those differences compound fast when margins are tight.
Here's what a real route profit calculation looks like:
Westside Thursday Route
-
Revenue
$820 (4 regular houses at $165, 2 apartments at $80)
-
Direct labor
$240 (2 cleaners × 6 hours × $20/hour)
-
Supplies used
$28
-
Vehicle costs
$38 (42 miles × $0.90/mile)
-
Allocated fixed costs
$147 (18% of $817 weekly fixed)
-
Route profit
$367
Eastside Monday Route
-
Revenue
$440 (2 houses at $160, 1 apartment at $120)
-
Direct labor
$200 (2 cleaners × 5 hours × $20/hour)
-
Supplies used
$19
-
Vehicle costs
$61 (68 miles × $0.90/mile)
-
Allocated fixed costs
$79 (9.6% of $817 weekly fixed)
-
Route profit
$81
Same crew size, similar hours, but one route generates $367 in profit while the other barely breaks even. The difference is density and distance.
Building your cost allocation template
Start by categorizing every expense as either fixed or variable. Fixed costs stay constant regardless of route volume—rent, insurance, admin salaries, software. Variable costs scale with operations—labor, supplies, fuel, vehicle maintenance.
Never miss a cleaning appointment again.
Maidufy helps you book, confirm, and manage every cleaning service seamlessly.
- Centralized booking management
- Automated client reminders
- Optimized staff scheduling
No credit card required
For fixed cost allocation, use this formula: Route Fixed Cost = (Route Revenue ÷ Total Revenue) × Total Fixed Costs
This proportional method means profitable routes carry more overhead burden, which makes sense since they benefit more from shared infrastructure.
Variable costs need different treatment. Track them directly to each route when possible. Labor hours × wage rates gives you direct labor. Miles driven × your per-mile vehicle cost gives you transportation. Supplies get trickier—you'll need consumption estimates by job type.
Most cleaning businesses find their true per-mile vehicle cost lands somewhere between $0.75 and $1.10 when they include everything: gas, insurance allocation, maintenance reserves, and depreciation.
Build a simple spreadsheet with these columns:
-
Route name/day
-
Total revenue
-
Number of stops
-
Total miles (from base, between stops, return)
-
Labor hours
-
Supply costs
-
Vehicle costs (miles × rate)
-
Allocated fixed costs
-
Net profit
-
Profit margin %
Update it weekly. Patterns emerge quickly—routes that looked profitable often aren't, and seemingly marginal routes sometimes perform better than expected once you factor in density.
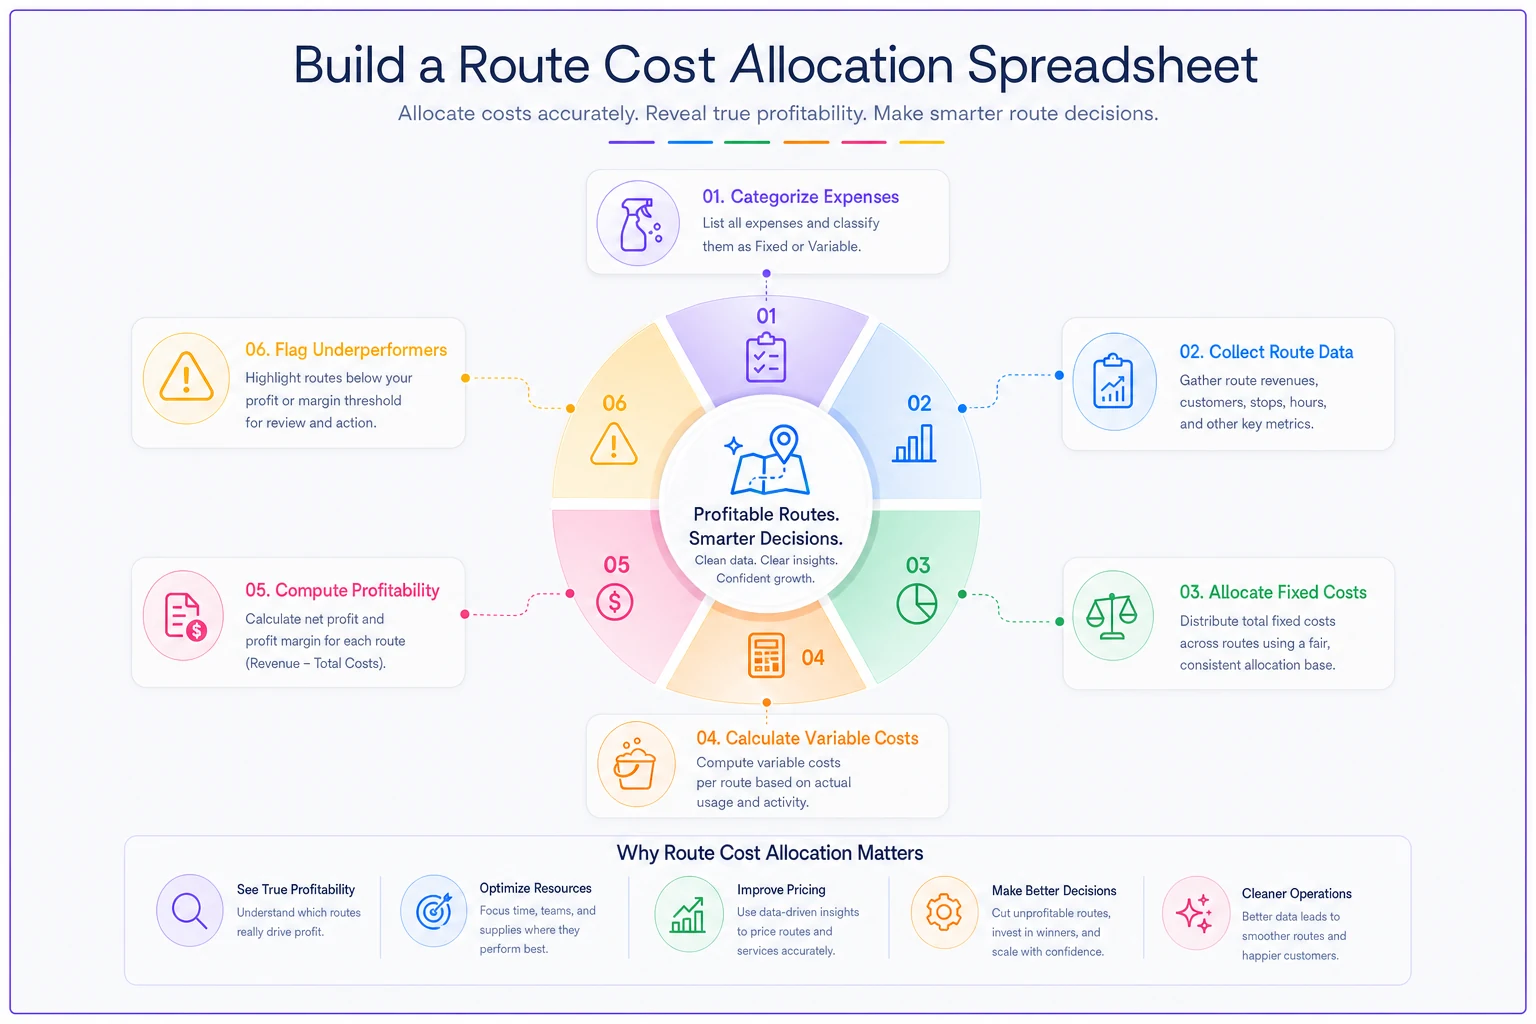
The diagram above lays out the spreadsheet workflow so you can follow the steps in order.
Demand thresholds for expansion decisions
Opening a new territory requires minimum demand levels to justify the investment. The threshold calculation factors in both immediate profitability and realistic growth potential.
Minimum Weekly Revenue = (Added Fixed Costs + Target Profit) ÷ (1 - Variable Cost Ratio)
Say you're considering expanding into Lakewood, 15 miles from your current base. Added fixed costs include route supervisor time ($200 weekly), vehicle allocation ($150), and initial marketing to build density ($300). Your variable cost ratio runs around 62% (labor, supplies, fuel as a percentage of revenue).
Minimum Revenue = ($650) ÷ (1 - 0.62) = $1,710 weekly
At a $160 average ticket, you need roughly 11 regular customers just to hit profitability. For healthy 25% margins, you're looking at $2,280 weekly—closer to 14 or 15 regular customers.
The demand assessment comes down to three things:
Current demand signals: How many quote requests from that area per month? Track zip codes on every lead, even the ones you decline. Eight to ten monthly inquiries from Lakewood that you're currently turning down due to distance is a meaningful signal.
Density potential: Look at competitor presence and housing patterns. A neighborhood with 800 single-family homes and two visible cleaning companies has more room than one with 400 homes and five competitors. Manual route planning becomes a lot more manageable in naturally dense areas.
Customer lifetime value: Some territories attract longer-retention customers. If Lakewood customers average 18 months versus your overall 11-month average, you can afford to accept lower initial density and still come out ahead.
Red flags that signal route sunset
Routes rarely die suddenly. They decay slowly—through customer attrition, rising costs, and operational friction. Catching the early signals lets you make a clean exit rather than bleeding money for months.
The clearest red flag is a sustained profit margin below 10%. When a route consistently delivers sub-10% margins for two months straight, the structural economics probably won't improve on their own. Either customer density dropped too low, drive distances stretched out as customers churned, or pricing sensitivity in the area shifted.
Churn patterns matter more than raw numbers. Losing one customer from a 12-stop route is painful but manageable. Losing one from a 4-stop route changes the economics entirely. When monthly churn exceeds 15% for three consecutive months, the route is effectively in a death spiral—remaining customers start feeling the service degradation as efficiency falls apart.
Operational friction compounds everything. Crews consistently running late on specific routes, quality complaints clustering in certain territories, constant staff shuffling to cover difficult runs—these aren't just scheduling problems. They're signs that the route design and operational reality are fundamentally misaligned.
A practical sunset checklist:
-
Calculate true profit margin for the past 12 weeks
-
Count active customers versus peak
-
Measure average drive time between stops
-
Track crew overtime frequency on that route
-
Document customer complaints by route
-
Calculate customer acquisition cost for that territory
If three or more indicators are trending negative, start planning the exit. Don't wait for profitability to hit zero.
Green light rules for expansion
Profitable expansion requires more than demand. Timing, sequencing, and operational readiness all matter—get any of them wrong and you're funding an expensive failure.
Rule 1: Adjacent territories first Expand into areas bordering profitable routes before jumping to disconnected ones. Adjacent expansion lets crews cover both areas in one trip, cutting deadhead miles significantly. A Riverside route that borders Corona makes more operational sense than jumping to Pasadena, even if Pasadena shows stronger demand numbers.
Rule 2: Demand depth of 3x minimum Don't expand when demand barely clears your minimum threshold. Wait until potential demand reaches roughly 3x your break-even requirement. That buffer accounts for conversion rate reality, seasonal fluctuation, and competitive response.
Rule 3: Operational capacity at 75% Never expand when you're already running at full capacity. If crews are working overtime weekly, if schedulers are struggling to fit appointments, or if quality is starting to slip—fix operations first. Expanding at 95% capacity breaks existing routes while failing to properly service new ones.
Rule 4: Cash reserves for 6-month loss New routes lose money initially, even with solid demand. Budget for six months of negative cash flow. Include marketing costs, inefficient routing during the buildup phase, and higher labor costs while crews learn new territories.
The profitability calculation template
Here's the exact template to calculate route profitability cleaning business metrics:
| Cost Category | Calculation Method | Eastside Example | Westside Example |
|---|---|---|---|
| Gross Revenue | Sum all jobs | $2,400 weekly | $4,100 weekly |
| Direct Labor | Hours × wages | $1,200 | $1,440 |
| Supplies | Jobs × consumption rate | $95 | $164 |
| Vehicle Costs | Miles × $0.90 | $234 | $126 |
| Fixed Allocation | Revenue % × fixed costs | $417 | $712 |
| Net Profit | Revenue - all costs | $454 | $1,658 |
| Margin % | Profit ÷ Revenue | 18.9% | 40.4% |
Run this monthly for every route. The patterns tell you everything: which routes subsidize others, where to focus growth, what to cut.
Don't use generic estimates for variable costs. Track actual supply usage—routes with heavy pet hair or hard water stains can consume 40% more supplies than average. Deep clean pricing modifiers affect route profitability directly when certain territories require more intensive work on a regular basis.
Making the tough calls
The numbers tell you what to do. Execution is the hard part. Sunsetting a route means telling loyal customers you can't service them anymore. It might mean difficult conversations with crew members who've been with you for years. These decisions get delayed because they're painful, not because the math is unclear.
Set decision triggers before you need them. When margin drops below 10% for eight consecutive weeks, initiate sunset planning. When qualified demand hits 3x threshold, approve expansion. Establishing the rules while you're thinking clearly removes emotion from the actual decision point.
For customer communication during a route sunset:
-
Give 60 days notice minimum
-
Offer to transition them to a trusted competitor
-
Provide detailed handoff notes to the new provider
-
Consider keeping one or two highly profitable stops if logistics genuinely allow it
Some operators hold onto unprofitable routes for strategic reasons—blocking a competitor foothold, maintaining crew hours, supporting a key referral source. That's a legitimate call if it's intentional. But know the cost. Track the subsidy amount monthly so strategic losses don't quietly become permanent drains.
Prevention beats correction
The best route profitability strategy prevents problems before they start. That means being selective about expansion, maintaining density standards, and reviewing route economics on a regular schedule—not just when something feels off.
Set minimum density standards and stick to them: no route with fewer than six regular customers, no route where average drive time between stops exceeds 20 minutes, no route requiring more than 45 minutes one-way from base. These guardrails stop marginal routes from ever getting started.
Price by territory. If eastside routes require 25% more drive time, prices should reflect that. Don't apologize for distance charges—explain them. Most customers understand that service costs more when you're driving farther.
Every quarter, look at whether customers could be reassigned to create better density across routes. Sometimes moving two customers from Tuesday to Wednesday transforms the economics of both days.
Track these leading indicators monthly:
-
Customer count by route
-
Average stops per route
-
Miles per revenue dollar
-
Crew utilization rate
-
Customer acquisition cost by territory
When indicators start trending negative, intervene before profitability evaporates. Add marketing to boost density, adjust pricing to improve margins, or consolidate routes to cut costs.
The technology multiplier
Modern operational software changes the route profitability equation by handling the tedious calculation work and surfacing issues faster than any spreadsheet can. AI-powered platforms can track true costs in real-time, automatically allocate overhead, and flag routes trending toward unprofitability before the margin damage is done.
Route optimization tools can consider multiple variables simultaneously—customer density, drive time, crew availability, profitability targets. What takes hours in a spreadsheet happens automatically, which frees you up to focus on the actual decisions rather than the data gathering.
The more useful advantage is pattern recognition. Automated tracking catches things that are easy to miss manually—like Tuesday routes consistently outperforming Thursday routes by 15%, or specific zip codes showing meaningfully higher customer retention. That kind of insight shapes smarter expansion and sunset decisions.
That said, software can't make the tough calls. It can tell you Route 3 is losing money, but you still have to decide whether the strategic value justifies the loss. It can surface expansion opportunities, but you have to assess whether you're actually ready for them.
Moving forward with clarity
Route profitability comes down to disciplined measurement and the willingness to act on what the numbers show. The math isn't complicated—allocate fixed costs proportionally, track variable costs directly, calculate margins by route. The hard part is actually doing something when the results aren't what you hoped.
Start this week with your most questionable route. The one where crews complain about drive time, where density has quietly dropped over the past year, where something just feels off. Run the full calculation with allocated fixed costs and true variable costs. Sometimes routes that feel inefficient actually perform okay. Sometimes routes that seem busy are quietly bleeding money.
The cleaning businesses that scale without falling apart understand route economics at a granular level. They know which territories generate profit, which ones drain resources, and exactly where the line sits between smart expansion and overextension. That kind of clarity—backed by consistent tracking and rules you actually stick to—is what separates growing companies from ones stuck in unprofitable sprawl.
Ready to elevate your cleaning business?
Join 500+ cleaning services using Maidufy to save time, reduce scheduling errors, and deliver exceptional client satisfaction.