



Most cleaning owners assume margin problems live in pricing or wasted supplies. But the biggest silent margin leak in a scaling cleaning business is almost always compensation drift — the slow, uncontrolled way pay grows as you add cleaners, managers, and territories without a system underneath it.
The pattern shows up constantly. You start with two cleaners you pay whatever felt fair at the time. You hire a third and match them to the second. Six months later, a strong hire negotiates a dollar more per hour. Now you have three people doing nearly identical work at three different rates, none of it tied to output. Multiply that across 15–20 field staff and two managers, and you have a payroll structure nobody actually designed — it just accumulated.
That's what this article is really about. Not "how much should I pay a cleaner," but how to build a pay bands cleaning business structure that holds up as you grow, ties compensation to operational reality, and stops labor cost from quietly eating the margin you worked hard to price in.
The real reason ad-hoc pay breaks at scale
At solo and duo stage, pay is easy because you feel every dollar. You know exactly what each person earns and what they produce. Coordination is trivial when the whole company fits in one van.
-
Rate compression. New hires get bumped to attract them, but your loyal early cleaners never get adjusted. Suddenly your best, most reliable people earn less than your newest, unproven ones.
-
Invisible pay-for-nothing. Someone gets a raise for tenure or for being pleasant to have around, not for hitting rework rates, on-time arrival, or client retention. You're paying more for the same output.
-
Manager guesswork. Without bands, every pay conversation is a one-off negotiation. Managers give raises to stop complaints, not to reward results, because they have no framework to point to.
This connects directly to the quality problems most scaling cleaners hit. When pay isn't tied to output, your strongest cleaners have no particular reason to stay strong and your weaker ones have no financial reason to improve. If you've read the hire-to-quality operations playbook, think of compensation as the economic engine underneath that quality system. Standards without pay structure rarely hold.
Start with roles, not rates
The mistake almost everyone makes is deciding pay before defining the job. You can't band what you haven't described. Before touching numbers, write down the actual roles in your operation — and be honest that most cleaning businesses have more than the two or three they admit to.
Never miss a cleaning appointment again.
Maidufy helps you book, confirm, and manage every cleaning service seamlessly.
- Centralized booking management
- Automated client reminders
- Optimized staff scheduling
No credit card required
A typical residential cleaning company at 15–25 staff really operates with these distinct roles:
-
Trainee cleaner — first 30–60 days, works supervised, not yet trusted solo.
-
Solo/lead cleaner — runs a home unsupervised, owns the checklist and client interaction.
-
Crew lead — runs a two-to-three person crew, responsible for the whole visit's quality.
-
Field supervisor / QA — spot-checks jobs, handles redos, coaches cleaners.
-
Ops manager — owns scheduling, staffing ratios, and territory-level KPIs.
Each role needs a one-paragraph definition covering what they own, what they're measured on, and what "good" actually looks like day to day. This isn't HR busywork. The definition is what justifies the band. A crew lead earns more than a solo cleaner not because of seniority but because they carry accountability for other people's output — and your pay structure should say that out loud.
Building pay bands that tie to ops KPIs
A band is a floor, a midpoint, and a ceiling for a role, plus the rules for moving through it. The key move — the one most owners skip — is attaching progression inside a band to operational metrics, not to time served.
Below is a sample structure for a mid-sized residential cleaner. Numbers are illustrative; adjust to your market, but keep the ratios between bands intentional.
| Role | Band floor | Midpoint | Ceiling | Moves up when… |
|---|---|---|---|---|
| Trainee cleaner | $16.00 | — | $17.00 | Passes 60-day checklist audit, <10% rework |
| Solo/lead cleaner | $17.50 | $19.50 | $21.50 | Rework <5%, on-time >95%, 90-day client retention holds |
| Crew lead | $20.00 | $22.50 | $25.00 | Crew rework <5%, redo rate low, trains 1+ hire |
| Field supervisor/QA | $23.00 | $26.00 | $29.00 | Territory QA score, redo cost per visit trending down |
| Ops manager | Salary $52k | $60k | $68k | Labor % of revenue in target range, retention targets |
Two things worth noticing here. First, the bands overlap — a top-of-band solo cleaner can out-earn a bottom-of-band crew lead. That's intentional. It rewards mastery without forcing everyone into management just to make more money. Second, every "moves up" trigger is measurable. A cleaner doesn't reach the ceiling because they've been around two years; they get there because their rework rate and retention numbers earned it.
The band ceiling matters as much as the floor. A ceiling stops uncontrolled drift. When someone hits the top of their band, the conversation shifts from "here's another raise" to "here's the next role, and here's what it requires." That one rule alone prevents most of the rate compression that wrecks margins over time.
-
Cleaner joins at band floor with defined role and KPI targets
-
First KPI check-in at 60 days — rework rate, on-time percentage reviewed
-
First earned band step triggers at 90 days if metrics qualify
-
Cleaner progresses toward midpoint as metrics consistently hold
-
Ceiling reached only when all progression criteria are sustained, not just hit once
-
Ceiling triggers a role conversation, not another raise within the same band
This sequence keeps progression visible and removes ambiguity from the process — for the cleaner and for whoever's managing them.
Short-term incentive recipes that don't backfire
Base pay rewards showing up and doing the job to standard. Incentives should reward the specific outcomes you can't easily buy with hourly wages — retention, low rework, tight scheduling. But poorly designed bonuses reward speed over quality and quietly increase redos. That's a problem cleaning owners create for themselves without realizing it.
A few incentive structures that actually hold up in the field:
Quality-gated visit bonus. Pay a small per-visit bonus, but only unlock it if the cleaner's rolling rework rate stays under a threshold. Example: $2 per completed visit, forfeited for the pay period if rework exceeds 5%. This pays for speed and quality together, never one without the other.
Retention share for leads. Give crew leads a monthly bonus tied to the 90-day retention of clients on their routes. Something like $50 per retained recurring client above a baseline. Leads start protecting relationships instead of just finishing jobs.
On-time streak bonus. A modest reward for a full pay period with zero late arrivals across a crew. Late arrivals are a top cancellation driver, so this is relatively cheap insurance for what it prevents.
Incentive = (base rate per unit) × (units) × (quality gate: 1 or 0)
When incentives are a bad idea
Skip incentives entirely if you don't yet measure rework or retention reliably. A bonus tied to a number you can't trust will reward the wrong people and teach your team the metric is a game to be gamed. Fix measurement first. An incentive layered on top of bad data doesn't motivate — it erodes trust.
A 12-month retention roadmap
Retention isn't a perk program. It's a compensation and career-visibility system spread across the year. Turnover in this industry runs brutally high, and every cleaner who quits at month five takes their training investment and their client relationships with them. The roadmap below assumes your bands and role definitions already exist.
-
Month 0–1 Clear role definition and band shown at hire. The cleaner knows the floor, the ceiling, and exactly what moves them up. Ambiguity at hire is the number-one early-quit driver.
-
Month 2 First KPI check-in. Not a formal review — a short conversation showing them their rework and on-time numbers against the band trigger.
-
Month 3 First earned band step if metrics qualify. A small, real raise at 90 days massively outperforms a bigger one at a year.
-
Month 4–6 Introduce one incentive recipe. Now that base progression is proven, layer in the quality-gated bonus.
-
Month 6 Cross-train signal. Identify who could become a crew lead and tell them the path. People stay for a visible next step.
-
Month 7–9 Mid-year band review across the whole team to catch compression before it spreads.
-
Month 9 Promote or formally sponsor your first internal crew leads. Internal promotion is the cheapest retention tool you have.
-
Month 10–12 Full-cycle audit — labor % of revenue, retention rate, average tenure — and reset band midpoints for the next year.
The reason this works is that it replaces the one-shot annual raise (which people forget within a month) with a steady drip of earned, metric-backed progression. Cleaners who can see their path and see their own numbers stay noticeably longer than those who can't.
This roadmap also ties directly into the delegation shifts covered in the stage-based growth blueprint — because you can't hand off management until your pay structure lets a manager make defensible pay decisions without calling you every time.
Manager routines that measure ROI on labor spend
A pay system nobody monitors drifts right back into chaos. The point of bands isn't to set them once and forget them — it's to give managers a repeatable routine for keeping labor spend honest. This is where the whole architecture either holds or collapses.
-
Weekly Pull labor hours against revenue by territory. Flag any route where labor % jumps above target. Catch it in days, not at month-end.
-
Monthly Review each cleaner's KPI position inside their band. Anyone stalled at the floor for 90+ days is a coaching or exit decision — not a "keep hoping" situation.
-
Quarterly Compression check. Sort everyone by pay and by output. Any spot where lower output earns higher pay gets fixed.
-
Quarterly Incentive audit. Are bonuses correlating with better retention and lower rework, or just adding cost? Kill any incentive that isn't earning its keep.
Here's a simple workflow to visualize the manager cadence.
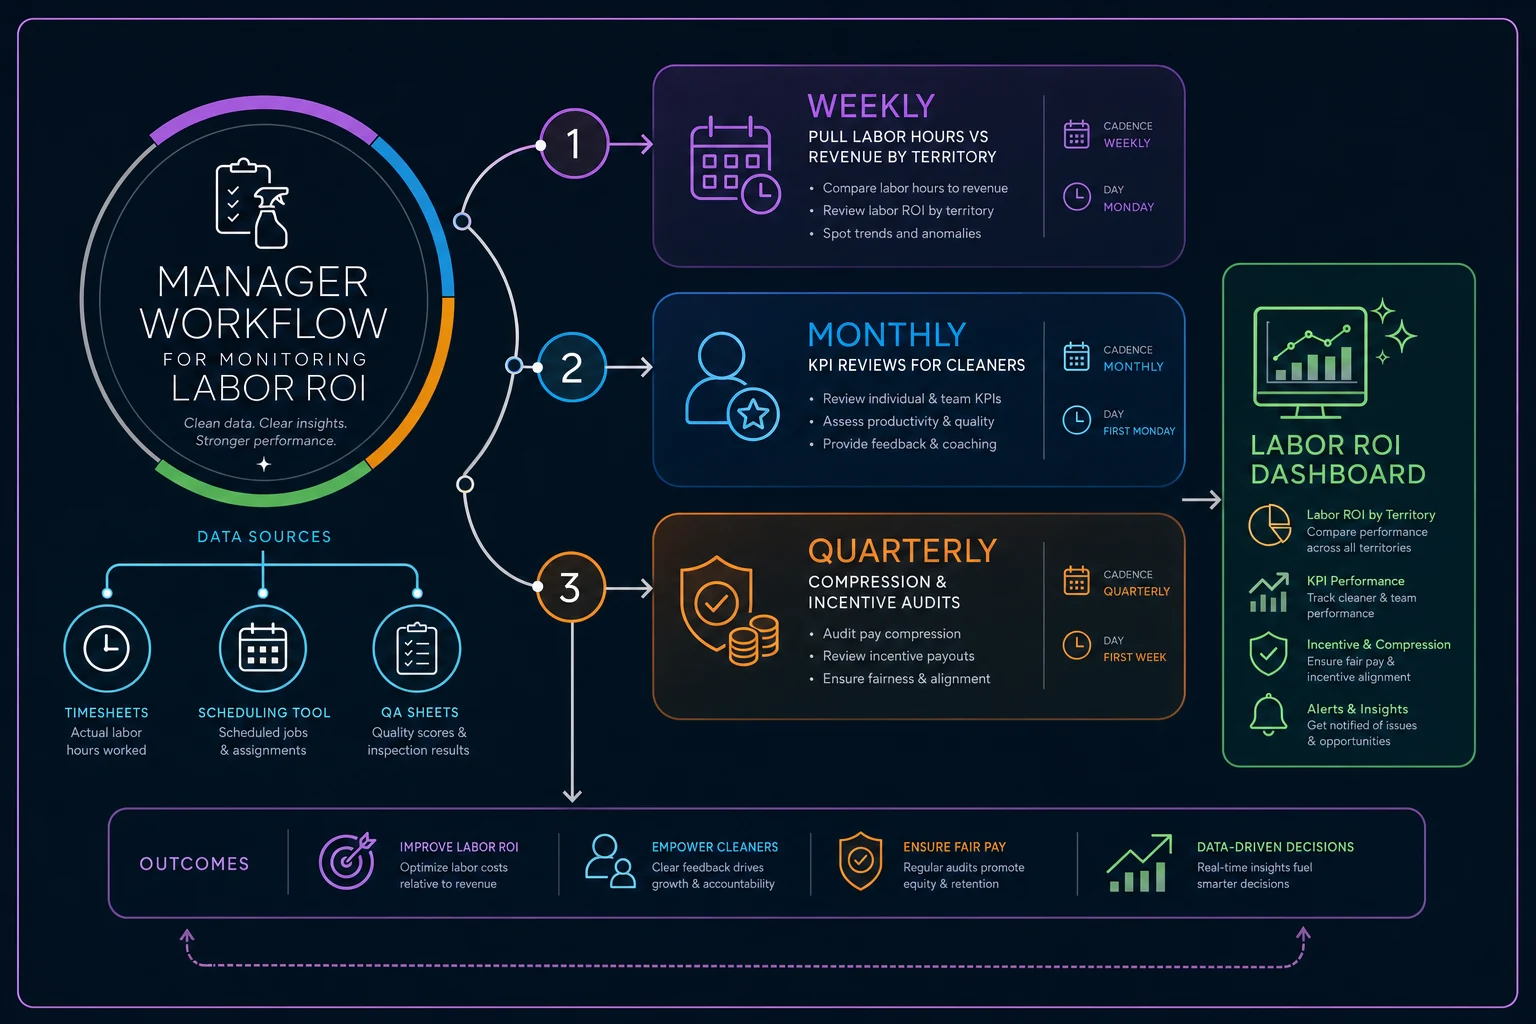
Run the weekly labor % check on Monday morning so small spikes get caught before they compound into a monthly problem.
The single number worth watching above all others is labor cost as a percentage of revenue per territory, tracked over time rather than as a monthly snapshot. A rising trend is your early warning that pay is drifting ahead of output. A flat or declining trend while quality holds means your architecture is doing its job.
Pulling these numbers manually across a dozen cleaners and several territories is where most owners give up — the data lives in timesheets, the scheduling tool, and QA sheets that don't talk to each other. Running scheduling, time tracking, and quality scoring on one operational platform puts labor hours, rework rates, and retention side by side so a manager can actually spot the drift the moment it starts. The framework matters most; the tooling just makes it visible enough to act on before it compounds.
A real scenario
A residential cleaning company with around 18 field staff across three suburbs had a payroll problem they couldn't name. Revenue was growing but margin was slipping — labor had crept to roughly 46% of revenue when they'd priced jobs assuming closer to 38%.
When they mapped everyone's rate against output, the cause was obvious. Their three most senior, lowest-rework cleaners earned about the same as two recent hires who'd negotiated hard at the door and had double the redo rate. There were no bands, so every raise had been a reaction to a complaint or a resignation threat.
They built five bands, wrote role definitions, and moved raises onto KPI triggers instead of tenure. They added one incentive — a quality-gated per-visit bonus — and ran the monthly compression check consistently. It wasn't instant. Over roughly three quarters, labor settled back toward the low 40s as a percentage of revenue, two strong cleaners moved into crew-lead roles instead of quitting for a dollar more elsewhere, and the constant one-off raise negotiations mostly stopped because people could actually see their own path forward.
The margin didn't come back from cutting pay. It came back from structuring it.
Where this leaves you
Compensation drift is a systems failure, not a generosity problem. It happens because pay accumulates faster than structure, and once you can't watch every cleaner personally, unstructured pay always drifts toward paying more for the same or worse output.
The fix is genuinely boring in the best possible way: define the roles, band the pay, tie progression to metrics you actually track, gate your incentives on quality, and give managers a routine to catch drift early. Do that consistently, and your labor line stops being the thing that quietly erases the margin you priced in — and starts being one of the few levers you actually control as you scale.
Ready to elevate your cleaning business?
Join 500+ cleaning services using Maidufy to save time, reduce scheduling errors, and deliver exceptional client satisfaction.