


You'd think hiring cleaners would be straightforward. Post the job, interview whoever shows up, check references, start them Monday. But residential cleaning businesses lose serious money through bad hires at a rate that would sink most other service businesses — not because they hire bad people, but because they have no operational framework connecting hiring decisions to what actually happens in the field.
The real problem isn't finding cleaners. It's building a hiring-to-quality workflow that ensures new hires actually deliver consistent service from day one.
Most cleaning business owners figure this out after their fourth or fifth bad hire. The cleaner who seemed perfect in the interview starts missing spots after week three. The experienced professional who promised reliability disappears two months in. The eager trainee who picked things up quickly during orientation suddenly can't keep pace on solo routes.
Each failed hire typically costs somewhere between $18,000 and $24,000 when you factor in recruiting time, training hours, lost customers from poor service, damage claims, and the chaos of constantly reshuffling schedules. For a business doing $400k annually, that's roughly 5% of revenue gone per bad hire.
Why Standard Hiring Breaks Down in Cleaning Operations
The cleaning industry faces a hiring challenge most generic advice ignores entirely: your workforce operates independently across dozens of locations every day with almost no supervision. A restaurant manager can watch new servers during their shift. A retail supervisor can coach cashiers in real time. Cleaning crews work alone in customers' homes, where a single bad experience can cost you a $3,600/year recurring contract.
Traditional hiring focuses on skills and experience. Can they clean? Have they done it before? Will they show up? These questions matter, but they miss the operational reality of residential cleaning. The person who cleans their own home obsessively might rush through customer homes when they're facing eight stops in a day. The commercial cleaner with five years of experience might not understand the intimacy of residential work, where customers notice if you moved their coffee mug two inches.
What actually predicts success in residential cleaning isn't raw cleaning ability — it's behavioral consistency under varying conditions. The cleaner who maintains quality standards whether they're ahead of schedule or running behind. Who follows the same checklist process in a spotless home as they do in a neglected one. Who communicates proactively when issues come up rather than hoping nobody notices.
Building a real cleaning operations playbook means creating systems that identify, develop, and maintain these behaviors across your entire workforce — not through motivation or management pep talks, but through operational structure.
The Three-Layer Hiring Framework That Actually Works
Among cleaning businesses that break the bad-hire cycle, a pattern emerges pretty consistently. They build hiring systems with three interconnected layers: behavioral screening, conditional onboarding, and performance measurement. Each layer feeds data into the others, creating a self-improving loop.
Never miss a cleaning appointment again.
Maidufy helps you book, confirm, and manage every cleaning service seamlessly.
- Centralized booking management
- Automated client reminders
- Optimized staff scheduling
No credit card required
Layer 1: Behavioral Screening Beyond the Interview
Forget personality tests. The most effective screening happens through structured scenarios that mirror actual job conditions. One approach that works well is a paid trial clean where candidates handle three homes of varying difficulty in a single day — not to test cleaning skills, but to observe behavioral patterns.
Do they maintain the same energy at house three as house one? How do they react when they encounter an unexpected mess? Do they ask questions or make assumptions? These observations predict performance far better than any interview question about "attention to detail."
Create a scoring matrix for trial cleans:
-
Time management (stays on schedule without rushing)
-
Consistency (same process each home)
-
Communication (reports issues promptly)
-
Adaptability (handles unexpected situations)
-
Self-direction (works without constant guidance)
Score each element 1–5, with specific behaviors defining each score. A "3" in time management means finishing within 10 minutes of scheduled time. A "5" means completing tasks efficiently with time left for quality checks. This removes subjective judgment from hiring decisions.
Layer 2: Conditional Onboarding That Builds Habits
Most cleaning businesses throw new hires into the field after a day or two of training. The ones that actually retain staff use progressive onboarding that builds operational habits gradually. Week one involves shadowing experienced cleaners — but not just watching. New hires document the process, creating their own version of the cleaning checklist based on observing top performers.
Week two introduces assisted cleaning where the new hire handles specific rooms while a trainer handles others. The trainer isn't just checking quality; they're tracking consistency. Does the new hire follow the same sequence each time? Do they self-correct when they notice something off?
Week three transitions to supervised solo cleans — the new hire works alone but gets inspected immediately after. This creates a feedback loop before bad habits have time to solidify. By week four, they're ready for regular routes but stay on a modified schedule with fewer homes and more buffer time for another two weeks.
This extended onboarding costs more upfront — roughly $1,800 in trainer wages and lost productivity per hire. But it cuts 90-day turnover from around 40% to under 15% for businesses that implement it fully.
Layer 3: Performance Measurement That Predicts Problems
The measurement system that works isn't about catching mistakes. It's about identifying patterns before they become problems. Track three key indicators weekly for each cleaner:
-
Completion variance
How much does their cleaning time vary for similar homes? High variance suggests inconsistent process or energy management issues.
-
Customer feedback lag
How many cleans before a customer complains? A shrinking lag time indicates declining standards.
-
Schedule flexibility
How often do they accommodate last-minute changes? Disappearing flexibility often shows up before turnover does.
Below is a visual workflow of the hiring-to-quality loop.
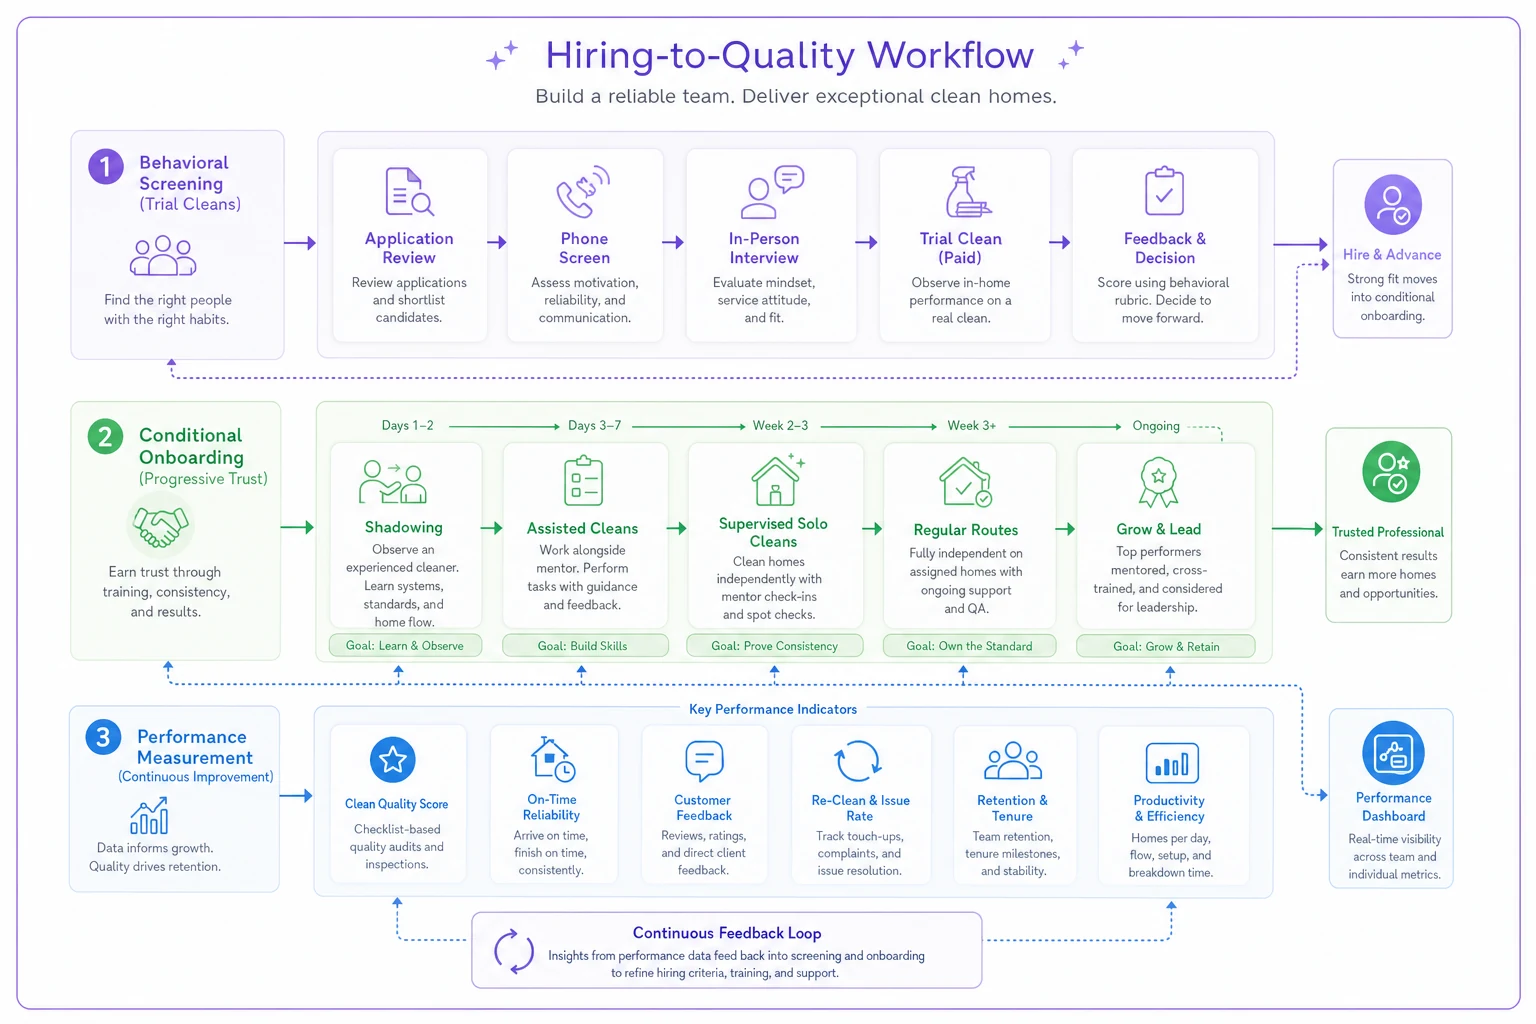
These metrics create early warning signals. When completion variance exceeds 20%, address it with process training. When feedback lag drops below 10 cleans, schedule a quality review. When flexibility disappears, have a retention conversation before you're scrambling to backfill the role.
Building SOPs That Split Recurring Work from One-Offs
A lot of the operational chaos in cleaning businesses comes from treating all work the same. Your cleaner shows up to Mrs. Johnson's biweekly clean with the same mental approach as Mr. Chen's move-out deep clean. That constant mental switching exhausts staff and creates quality inconsistencies that are hard to trace back to anything specific.
Recurring Clean SOPs: Speed Through Systemization
Recurring cleans make money through efficiency. Same home, same tasks, same sequence, every time. The SOP should eliminate decision-making entirely.
Structure recurring SOPs around zones, not tasks. Instead of "dust all surfaces," specify "Zone 1 (entryway): dust in clockwise sequence starting from door — console table, mirror frame, light switch, baseboard." This zone approach lets cleaners develop muscle memory that speeds up over time without sacrificing consistency.
Include timing benchmarks for each zone based on home size. A 2,000 sq ft home might allocate:
| Zone | Area | Time Target |
|---|---|---|
| Zone 1 | Entryway/hallway | 8 minutes |
| Zone 2 | Living room | 15 minutes |
| Zone 3 | Kitchen | 20 minutes |
| Zone 4 | Primary bathroom | 18 minutes |
| Zone 5 | Bedrooms | 12 minutes each |
These aren't hard cutoffs, just targets that help cleaners self-regulate pace. When someone consistently beats their times, you can add another home to their route. When they're consistently over, you can identify training needs before quality starts slipping.
Build "maintenance triggers" into recurring SOPs — specific observations that generate additional tasks. Soap scum buildup triggers a descaling protocol. Dust on ceiling fans triggers a quarterly rotation. This prevents the gradual quality drift that quietly loses long-term customers.
One-Off Clean SOPs: Flexibility Within Framework
One-off cleans — deep cleans, move-outs, post-construction — require different operational logic. These jobs make money through thoroughness, not speed. The SOP needs to guide decision-making rather than eliminate it.
Structure one-off SOPs as decision trees. Start with assessment: What's the soil level? What's the primary concern? What's the time constraint? Then branch to appropriate protocols.
-
Visible mold/mildew? → Apply treatment, extend time 30 minutes
-
Mineral deposits on fixtures? → Use descaling protocol
-
Grout discoloration? → Determine if cleaning or sealing is needed
-
Normal soil level? → Standard deep clean sequence
This framework lets cleaners adapt to what's in front of them while still following a consistent process. They're not making random judgment calls — they're following predetermined paths based on conditions.
Include photo documentation requirements in one-off SOPs. Before photos establish condition, after photos prove completion. This protects against damage claims and gives you real training material when onboarding future staff.
Week-by-Week Manager Routines That Maintain Standards
The difference between cleaning businesses that scale past 10 employees and those that stall isn't systems — it's management routines that ensure those systems actually get followed. Most owners know they should inspect quality, review numbers, and coach staff. But without structure, these activities happen sporadically when things go wrong rather than consistently enough to prevent them.
Week 1: Quality Calibration
Every month starts with quality calibration. First Monday, managers shadow different cleaners for two or three homes each. Not inspecting — observing process. Are they following the SOP sequence? Where do they deviate and why? The goal isn't catching mistakes; it's understanding how standards drift in the field.
Tuesday through Thursday, conduct spot inspections on about 20% of completed cleans. Use a randomizer to select which homes — predictable inspections change behavior temporarily, random ones reveal actual performance. Score using the same checklist customers see.
Friday, compile observations into a drift report. What patterns showed up? If multiple cleaners are skipping baseboards, that's a training issue. If one cleaner consistently rushes bathrooms, that's individual coaching. If everyone struggles with the same home, that might be a customer or pricing problem.
Week 2: Performance Review
Second week focuses on individual performance metrics. Monday, pull completion times for all recurring cleans. Calculate variance by cleaner and by route. High variance suggests process issues; consistent slowness might point to routing problems.
Tuesday and Wednesday, review customer feedback with each cleaner individually — not just complaints, all feedback. Show them patterns. "You consistently score well on kitchens but get mixed feedback on bathrooms. Let's walk through your bathroom sequence." This frames feedback as a development conversation, not a disciplinary one.
Thursday, analyze supply usage by cleaner. Excessive product use can indicate inefficiency or a cleaner trying to compensate with more product for quality they know isn't there. Unusually low usage might suggest skipped steps. One cleaner using three times more glass cleaner than the rest warrants a closer look.
Friday, update performance scorecards. Each cleaner gets a simple visual showing their metrics versus team averages — not rankings, just context. Transparency reduces surprises during formal reviews.
Week 3: Process Optimization
Third week examines system performance rather than people performance. Monday, ride along with your fastest cleaner. Document their techniques, shortcuts, and sequence variations. What makes them efficient without sacrificing quality?
Tuesday, ride along with your highest-quality cleaner. What additional steps do they take? Where do they spend extra time?
Wednesday, compare the differences. Top performers usually have developed small optimizations — carrying supplies differently, sequencing tasks to minimize movement, batching similar activities. These become training material worth capturing and building into your SOPs.
Thursday, test process improvements with willing cleaners. If the fast cleaner's bathroom sequence saves three minutes without any quality loss, trial it with a few others and track results.
Friday, update SOPs based on what actually worked. Small optimizations compound. Saving two minutes per bathroom across eight homes daily adds up to over an hour a week — enough time for an additional clean.
Week 4: Strategic Planning
Final week shifts to looking ahead. Monday, review turnover patterns. Which routes lose cleaners most often? What do those routes have in common — difficult customers, excessive drive time, physically demanding homes? Replacing people without addressing root causes just restarts the cycle.
Tuesday, analyze route profitability including labor, supplies, drive time, and complaint rates. Some routes generate revenue while quietly draining profit. Better to sunset unprofitable routes than hold onto them out of habit.
Wednesday, plan next month's hiring needs based on turnover trends, seasonal demand, and growth targets. Starting recruitment early reduces desperate hiring. Build pipeline continuously rather than reactively.
Thursday, schedule training based on the drift report findings from week one. Block it in next month's calendar now — training that gets postponed almost never happens.
Friday, communicate plans to the team. Share wins from process improvements, announce training schedules, recognize individual improvements. Transparency builds accountability without creating a punitive culture.
KPI Dashboards That Reveal Problems Before Customers Notice
Most cleaning businesses track lagging indicators — customer complaints, turnover, revenue decline. By the time those metrics move, the damage is already done. Effective operations track leading indicators that surface issues before customers feel them.
The Service Consistency Index
Create a composite metric combining three factors:
-
Completion time variance (standard deviation of cleaning times for similar homes)
-
Checklist adherence rate (percentage of tasks completed per inspection)
-
Customer contact rate (how often customers reach out between cleans)
Weight these equally and index to 100. A score below 85 suggests problems developing. Below 75 means something needs immediate attention.
Track this weekly by cleaner and by route. Declining scores tend to predict customer cancellations four to six weeks before they happen. When someone's consistency index drops from 92 to 78 over three weeks, you have a window to intervene before a long-term customer decides to quietly cancel.
The Operational Stress Score
Measure system strain before it causes breakdown:
-
Schedule compression (percentage of routes running at maximum capacity)
-
Overtime hours (weekly overtime as percentage of regular hours)
-
Call-out rate (unexpected absences per 100 scheduled shifts)
-
Rework rate (cleans requiring return visits)
Score each factor 1–5 based on predetermined thresholds, then average for an overall stress score. Above 3.5 means the operation is stretched — quality will suffer soon.
This metric should drive capacity decisions. When the stress score exceeds 3.5 for two consecutive weeks, stop accepting new customers until staffing catches up. Growing revenue while quality degrades just accelerates churn.
The Employee Stability Metric
Predict turnover before it happens by tracking:
-
Schedule flexibility requests (declining flexibility often signals life changes)
-
Communication responsiveness (delayed responses indicate disengagement)
-
Supply management (carelessness with supplies suggests someone who's mentally checked out)
-
Peer feedback (team members usually notice disengagement before managers do)
Score monthly by employee. Sudden drops tend to correlate with turnover within 30 to 45 days — enough lead time to begin recruiting before the position officially opens.
The Profitability Per Hour (PPH) Tracker
Move beyond gross revenue to understand true operational efficiency: PPH = (Revenue - Direct Costs) / Total Labor Hours Direct costs include supplies, vehicle costs, and insurance. Total labor hours include cleaning time, drive time, and administrative time.
| Dimension | What It Reveals |
|---|---|
| By cleaner | Training needs and efficiency gaps |
| By route | Unprofitable territories |
| By service type | Where to focus sales efforts |
| By day of week | Scheduling optimization opportunities |
Most cleaning businesses find their PPH varies by 40% or more across these dimensions. Tuesday recurring routes might generate $38/hour while Thursday one-offs come in at $24/hour. That kind of visibility enables real decisions about service mix and routing rather than gut instinct.
Implementation Checklist: From Chaos to Control
Building this kind of operational system feels overwhelming when you're already drowning in daily problems.
Phase 1: Stop the Bleeding (Weeks 1–2)
-
Implement basic quality checklists if you don't have them. Even a simple 20-point checklist improves consistency immediately.
-
Start tracking completion times for all cleans. Use paper if you have to — data collection matters more than sophistication at this stage.
-
Create separate one-off and recurring clean protocols, even if basic. The mindset shift alone helps.
-
Begin random spot inspections on 10% of cleans. Don't overthink the scoring system — just start observing.
-
Calculate your current PPH, even with rough numbers. You need a baseline before you can measure improvement.
Phase 2: Build Foundation (Weeks 3–6)
-
Design your behavioral hiring matrix. Test it with your next hire and refine based on what you learn.
-
Develop zone-based SOPs for your top three recurring services. Version 1.0 is fine — iterate from there.
-
Implement weekly manager routines, starting with quality calibration. Build the habit before adding complexity.
-
Create performance scorecards with three or four key metrics. Keep it simple
completion times, quality scores, customer feedback.
-
Launch conditional onboarding with an extended training period. Yes, it costs more upfront. Yes, it's worth it.
Phase 3: Optimize Operations (Weeks 7–12)
-
Expand SOPs to cover all service types, including decision trees for common scenarios.
-
Build your KPI dashboard with leading indicators and start tracking weekly patterns.
-
Implement the full four-week manager routine cycle. Block calendar time and treat these as non-negotiable.
-
Analyze route profitability and make hard decisions about territories that aren't pulling their weight.
-
Create feedback loops where KPI insights drive SOP updates and training priorities.
Phase 4: Scale Systems (Ongoing)
-
Document everything as you go. Today's solution becomes tomorrow's training material.
-
Promote top cleaners to trainers. This creates advancement paths while keeping standards intact.
-
Use AI-powered operational software to automate routine tracking and reporting. Platforms built with AI automation can monitor KPIs, flag anomalies, and generate performance reports automatically — freeing managers to focus on actual intervention rather than data collection.
-
Regularly audit system adherence. Success breeds complacency, and standards drift faster than most owners expect.
-
Share metrics transparently with the team. When everyone can see the scoreboard, performance tends to improve on its own.
Start by documenting the SOPs for your top three most profitable routes — they give the best return on optimization effort.
The businesses that actually get there follow a phased approach — quick wins first, then build toward comprehensive control.
The Real Cost of Not Having Systems
A cleaning business doing $500k annually without these systems typically runs 8–12% profit margins. Bad hires cost around $20k each. Quality issues lose two or three customers a month at roughly $3,600/year per customer. Inefficient routing wastes over an hour daily across the team — somewhere around $30k annually in lost productivity.
The same business with solid operational systems can realistically hit 18–25% margins. Not by charging more or paying less, but through operational efficiency. Hiring success rates improve. Customer retention extends. Routes run more efficiently because the processes behind them are actually consistent.
The gap between these two scenarios isn't effort — it's whether the business runs on systems or on heroic improvisation. Every successful cleaning business figures this out eventually. The question is whether you get there through years of painful trial and error or build the infrastructure earlier.
Building this kind of playbook isn't about perfection. It's about compounding small improvements. Better hiring leads to consistent service. Consistent service improves retention. Better retention increases profitability. Higher profitability supports better wages, which attracts better talent. The cycle reinforces itself.
The cleaning businesses that hold up over time aren't necessarily the ones with the best cleaners or the most customers. They're the ones that build operational systems capable of delivering consistent quality regardless of who's holding the mop. That's what turns a cleaning business from a job that owns you into an asset that actually works for you.
Ready to elevate your cleaning business?
Join 500+ cleaning services using Maidufy to save time, reduce scheduling errors, and deliver exceptional client satisfaction.