


Most cleaning businesses don't have a data problem. They have a data-trust problem. Numbers are everywhere — in the scheduling app, in QuickBooks, in a manager's head, spread across three spreadsheets that all disagree about how many jobs ran last month. When an owner asks "how are we doing?" the honest answer is usually "give me a day to figure that out."
That gap between having data and being able to use it is what data maturity actually means for a cleaning business. It's not about fancy tools. It's about whether your numbers arrive on time, mean the same thing week to week, and lead to an actual decision. This article walks through the stages most cleaning companies pass through, what breaks at each one, and how to build metric definitions and decision rhythms that hold up as you grow.
The three stages almost every cleaner passes through
The path from a solo operator to a company running multiple crews follows a pretty predictable data arc. You don't skip stages — you outgrow them.
| Stage | How data lives | What it's good for | Where it breaks |
|---|---|---|---|
| Stage 1 — Spreadsheets | Manual sheets, updated when someone remembers | Getting off the ground, one person holding the whole picture | Two people editing, month-end math, anything requiring history |
| Stage 2 — Integrated dashboards | Systems connected, numbers pulled automatically | Seeing the business without manual re-entry | Nobody's watching the dashboard; data flows but no one acts |
| Stage 3 — Automated alerts | The system flags problems before you notice | Catching issues while they're still small | Alert fatigue, thresholds set wrong, ignoring the warnings |
The mistake owners make is thinking Stage 3 is the goal and Stage 1 is embarrassing. It isn't. Plenty of profitable two-crew operations run beautifully on a well-built spreadsheet. The problem isn't the stage — it's staying in a stage after your operation has outgrown it.
Stage 1: spreadsheets, and why they quietly stop working
A single owner-operator can run everything from one sheet. Jobs, prices, who paid, which clients are recurring. It works because there's one source of truth and one person maintaining it.
Never miss a cleaning appointment again.
Maidufy helps you book, confirm, and manage every cleaning service seamlessly.
- Centralized booking management
- Automated client reminders
- Optimized staff scheduling
No credit card required
What breaks it isn't volume — it's people. The moment you add a second person who touches the numbers, the spreadsheet starts lying. Someone logs a deep clean as a standard clean. Someone forgets to mark a cancellation. Someone copies last week's tab and edits the wrong cells. By month-end, the sheet says you did 84 jobs and your calendar says 91, and you're spending a Saturday evening reconciling instead of running your business.
The subtler failure is that spreadsheets have no memory of how a number was calculated. If you changed how you count "recurring clients" in March, your January-to-June trend is garbage — and you won't even know it.
Stage 2: integrated dashboards, and the trap of pretty charts
Owners usually jump to dashboards after one too many painful month-ends. Connect the scheduling tool to accounting, pull it into a dashboard, and suddenly numbers update themselves. Feels like a massive leap.
The trap: a dashboard nobody looks at is just a slower spreadsheet. What tends to happen across smaller operations is the dashboard gets built with real enthusiasm, checked daily for a couple weeks, then quietly abandoned. The data keeps flowing. The decisions stop.
The other Stage-2 failure is more technical. When you pull from three systems, you inherit three different definitions. The scheduler counts a job when it's booked. Accounting counts it when it's paid. Your dashboard now shows "jobs" three different ways depending on which chart you're looking at, and people stop trusting all of them.
Stage 3: automated alerts, and why most owners set them up wrong
The real payoff of data maturity is not looking at numbers at all — it's the system telling you when something moves in a way that matters. Route profit dropped below your floor. A recurring client missed two visits. Payroll hours came in 12% over booked hours this week.
Alerts fail in two directions. Set them too loose and you miss what mattered. Set them too tight and you get 40 notifications a day until everyone mutes the channel — then a real problem slips through because it looked like noise.
The businesses that get this right treat alerts like a hiring decision: each one has to earn its place by pointing to a specific action. If an alert fires and nobody knows what to do about it, it shouldn't exist.
Canonical metric definitions: the boring work that saves you
The single highest-leverage thing you can do — at any stage — is write down what your metrics mean. Not the values. The definitions. Almost everyone skips this, and it's exactly why numbers stop being trustworthy.
-
Completed job — a visit that actually happened and passed QA. Not booked. Not scheduled. Completed. A cancellation with a fee is not a completed job; it's a cancellation-with-fee, tracked separately.
-
Active recurring client — a client with a scheduled recurring slot who has had a visit in the last 45 days. The 45-day window matters. Without it, "recurring" slowly fills up with dead accounts.
-
Revenue per labor hour — collected revenue divided by paid crew hours, including drive time. Not booked hours. Paid hours. This is the number that actually tells you whether you're making money on the ground.
-
First-visit conversion — one-off or trial clients who booked a second visit within 30 days. Your whole retention story lives in this one.
-
Rework rate — visits that required a return trip or redo, as a share of completed jobs. Small number, huge signal.
Tape the canonical definitions somewhere visible so people can't claim they didn't know.
A metric with a fuzzy definition is worse than no metric, because it creates false confidence. "Retention is up!" means nothing if last quarter you counted by client and this quarter you're counting by revenue.
Write these definitions once, put them somewhere visible, and change them only on purpose — with a note about when and why. That one habit is the difference between a trend line you can trust and a decoration.
A simple dataflow sketch (ETL without the jargon)
ETL sounds intimidating. For a cleaning business it just means: Extract the data from where it's created, Transform it into consistent definitions, and Load it somewhere you can actually read it. Here's what that looks like on the ground.
Here's what that looks like on the ground.
-
Extract — Data is born in a few places
your scheduling/booking tool (jobs, clients, cancellations), your time-tracking (crew hours, drive time), and your accounting (invoices, payments). These are your sources. Nothing gets typed in twice.
-
Transform — This is where the canonical definitions live. A booked job becomes a "completed job" only when time-tracking confirms the crew was on site and QA passed. Paid hours come from time-tracking, not the schedule. Revenue gets matched to the visit, not just the invoice date.
-
Load — The cleaned-up numbers land in one place — a dashboard, a summary sheet, whatever people actually open. Critically, this is the only place people go for numbers. If your manager is still pulling stats from the raw scheduler, you've defeated the whole thing.
A quick visual of this ETL flow:
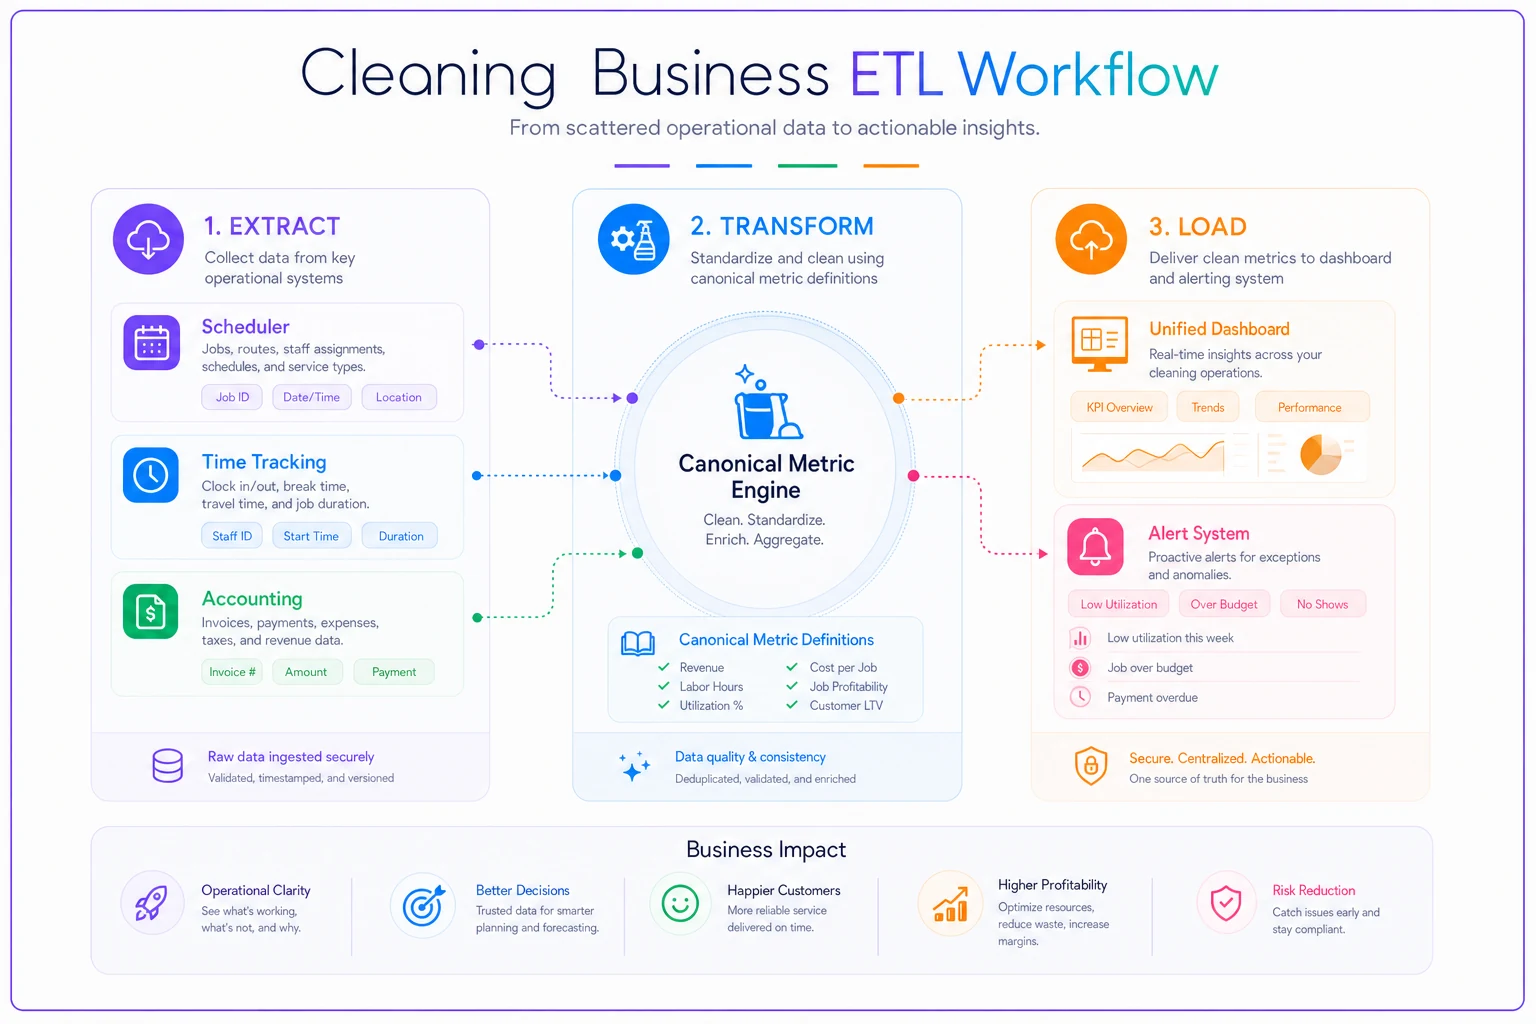
The most common breakage happens at the transform step, almost always because definitions weren't written down first. Garbage definitions in, confident-looking garbage out.
You don't need enterprise software to run this. A small cleaner can do a lightweight version with connected tools and one weekly refresh. The point isn't automation for its own sake — it's that the transform rules stay consistent whether it's a busy week or a slow one. This is where a purpose-built operations platform earns its keep: definitions get enforced once, so a rushed manager can't accidentally count things two different ways.
Mapping data to decisions: weekly vs monthly cadence
Data maturity is pointless if numbers don't hit a meeting where a decision actually gets made. Assign each metric to a rhythm and to an action. Numbers without a cadence just pile up.
The weekly view — operational, fast, corrective
Weekly numbers are about catching problems while you can still fix them this week. Keep it short.
This pairs naturally with a tight operational rhythm — the kind of 30-minute weekly ops board a manager can run without it turning into a meeting nobody wants to attend.
-
Rework rate this week → if above your line, pull the QA notes and identify which crew or client.
-
Paid hours vs booked hours → a gap means estimates are off or time is leaking; check the outlier jobs.
-
Cancellations and reschedules → a cluster on one client or one day means a scheduling or reminder problem.
-
New client second bookings → slipping conversion means onboarding needs attention now, not next quarter.
The monthly view — strategic, trend-based, structural
Monthly is where you look at direction, not incidents. This is the cadence for pricing, territory, and staffing calls — decisions that shouldn't be made on a bad Tuesday.
-
Revenue per labor hour, by route → this is where you decide whether a territory is earning its place.
-
Active recurring client count → the health of your recurring base is your most important slow-moving number.
-
Margin by service type → deep cleans, standards, move-outs behave differently; watch them separately.
-
Rework rate as a trend → one bad week is noise; three rising months is a training or hiring problem.
Monthly is also when unit economics come into focus. If you want the full breakdown of how these numbers roll up into real profit-per-job, the owner-ready unit-econ dashboard approach connects these metrics directly to margin.
The pattern to internalize: weekly = fix, monthly = decide. Making structural decisions off weekly noise leads to whiplash. Catching operational problems only monthly means you find them a month too late.
A real scenario: from spreadsheet fog to a working rhythm
A residential cleaning company running three crews — somewhere around 330 to 360 completed jobs a month — was stuck in Stage 1 well past its expiration date. The owner had a master spreadsheet, but both managers kept their own side-sheets because the master was always stale. Month-end took most of a Saturday, and the numbers still felt shaky.
The visible symptoms: they couldn't tell which route was actually profitable, and they discovered a chronically underperforming territory only after it had been bleeding for months. Rework was happening but nobody was counting it, so the same client kept getting redo visits with no one connecting the dots.
They didn't buy anything fancy at first. Three things:
-
Wrote canonical definitions for six metrics and taped them, literally, above the manager's desk.
-
Connected the scheduler and time-tracking so paid hours stopped being estimated.
-
Set a weekly 30-minute review and a monthly one, each with a fixed list of numbers.
Within about two months, month-end went from most of a day to under an hour. They found that one route was running roughly $6–8 lower revenue-per-hour than the others once drive time was counted properly — a gap that had been invisible in the old sheet. Rework, once they actually tracked it, turned out to be concentrated on one crew's move-out cleans, which became a training fix rather than an ongoing mystery. Nothing dramatic on paper. But the owner stopped guessing.
When to move up a stage — and when to stay put
Not every cleaner needs automated alerts. Chasing Stage 3 too early just adds complexity you have to maintain.
Move to integrated dashboards when: month-end reconciliation is eating real hours, two or more people touch the numbers, or you can't answer "which route makes money" without a mini research project.
Move to automated alerts when: you're consistently acting on your dashboard, you know exactly which three or four numbers would change a decision, and problems are reaching you too late because nobody's watching every day.
Stay where you are when: you're a solo operator or single crew, your spreadsheet is accurate, and month-end takes twenty minutes. Adding infrastructure a business doesn't need is its own kind of waste.
Who should not rush this: anyone whose real problem is inconsistent service or a broken onboarding flow. No dashboard fixes a process that doesn't exist yet. Get the operation working, then measure it. Measuring chaos just gives you very precise pictures of chaos.
Closing thought
The reason data maturity matters isn't the reporting — it's that mature data lets you make calm decisions instead of reactive ones. When your numbers arrive on time, mean the same thing every week, and each one points to an action, running a cleaning business gets quieter. Fewer Saturday spreadsheet marathons. Fewer surprises. Fewer "I think we made money on that job."
Start with the definitions, because they're free and they're the foundation everything else sits on. Then connect your data so it stops being re-typed. Then, only when you're already acting on what you see, let the system start flagging things for you. Move at the pace your operation actually needs — not the pace of whatever tool you saw advertised. The businesses that get this right aren't the ones with the most data. They're the ones who actually believe the data they have.
Ready to elevate your cleaning business?
Join 500+ cleaning services using Maidufy to save time, reduce scheduling errors, and deliver exceptional client satisfaction.