
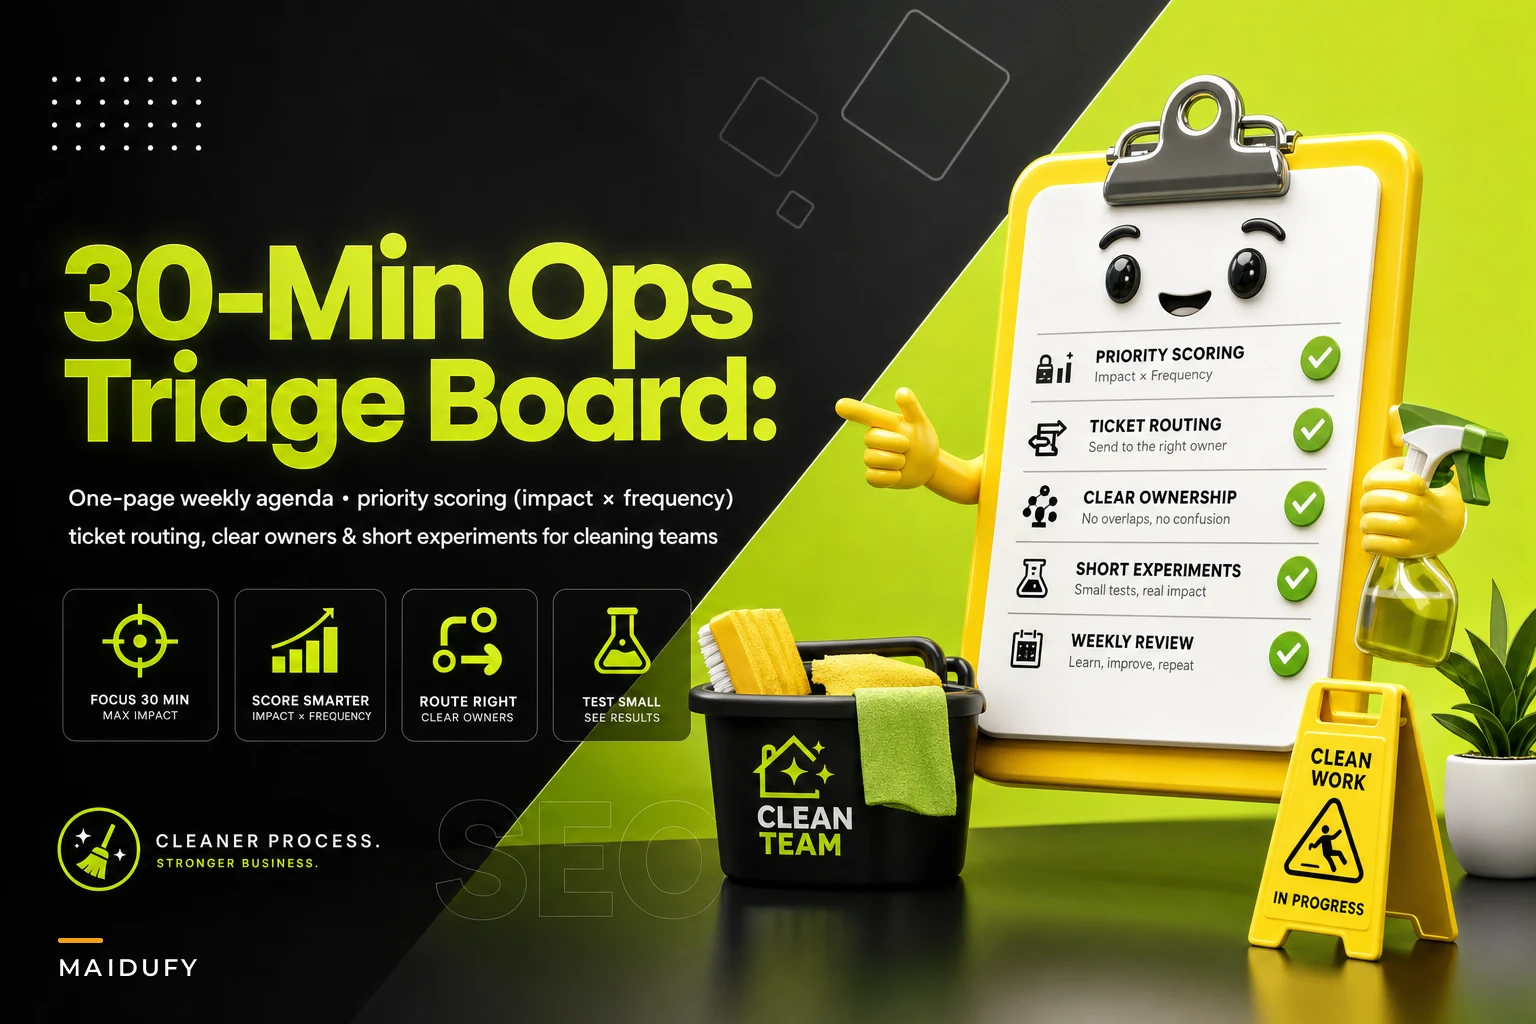

Most cleaning managers already collect QA data. Inspection scores, client complaints, re-clean requests, photo flags — it's all sitting somewhere. The problem isn't collecting it. The problem is that on Monday morning, all that data turns into a vague feeling of "we've got quality issues" instead of a clear answer to what do we fix this week.
That gap is where a weekly ops board earns its keep. Not a two-hour meeting. Not a dashboard nobody opens. A 30-minute triage session, run the same way every week, that converts last week's QA noise into three or four prioritized fixes with owners attached.
This is the exact agenda, the scoring method, the routing rules, and a couple of short experiments you can run to test whether your fixes actually worked. Built specifically for small residential cleaning teams — the kind running 4 to 25 cleaners, where the owner or a lead is doing this triage themselves.
Why QA data usually goes nowhere
The failure isn't lazy managers. It's that raw QA data has no ranking built into it. Every complaint feels urgent when you read it. A client furious about a missed toilet and a client mildly annoyed about a smudged mirror both land in the same inbox with the same emotional weight.
So one of three things happens:
-
The manager fixes whatever complaint is loudest that day (recency bias)
-
The manager fixes whatever's easiest (avoidance)
-
The manager tries to fix everything, burns out, and fixes nothing systematically
What tends to happen across small cleaning operations is that the same 3-4 issues drive most of the re-cleans, but they're buried under a dozen one-off complaints that will never happen again. Without a scoring step, you can't tell the difference between a pattern and a fluke.
A weekly ops board fixes this by forcing two questions before anything gets worked on: how bad is this and how often does it happen. Everything else is noise until you answer those.
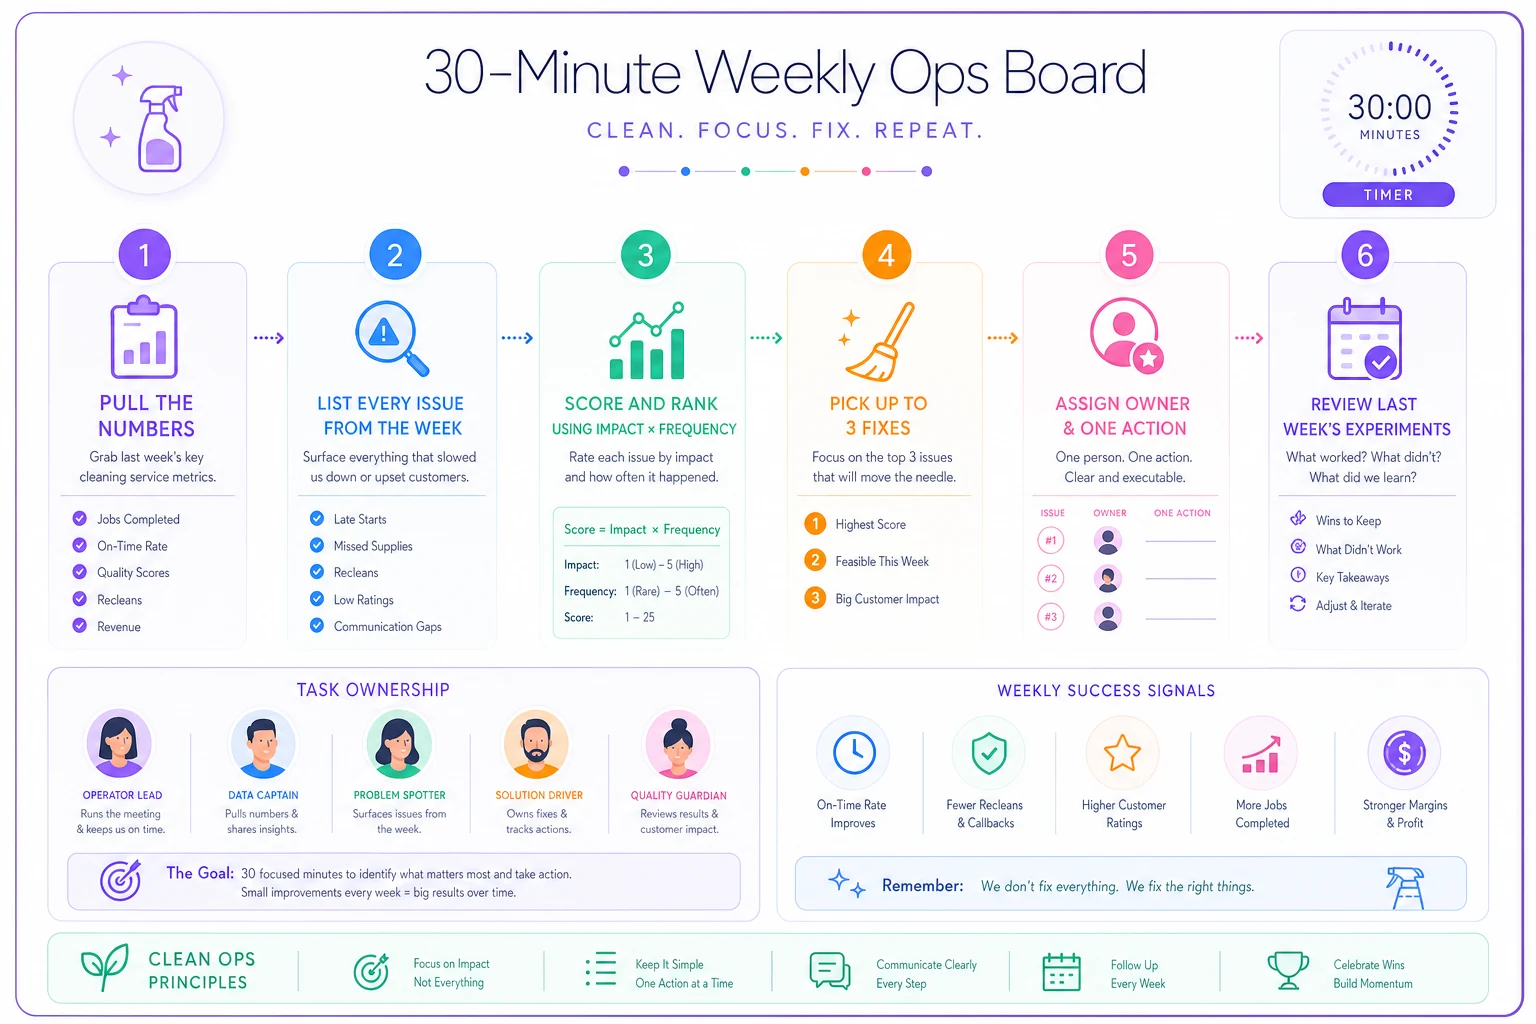
The one-page weekly agenda
Keep the whole thing on a single page. If it needs a second page, you've over-engineered it. Here's the structure that actually holds up week to week:
Never miss a cleaning appointment again.
Maidufy helps you book, confirm, and manage every cleaning service seamlessly.
- Centralized booking management
- Automated client reminders
- Optimized staff scheduling
No credit card required
-
Pull the numbers (5 min) — Total jobs completed, number of QA flags, number of re-cleans, number of client complaints. Just the counts. You're establishing volume before you look at details.
-
List every issue from the week (7 min) — One line each. "Master bath shower missed — Tuesday, Riverside route." Don't editorialize. Just log what happened and where.
-
Score and rank (8 min) — Apply impact × frequency to each line (method below). Sort highest to lowest.
-
Pick 3 fixes max (3 min) — Top of the list only. Everything below the cutoff waits until next week or dies on its own.
-
Assign owner + one action each (5 min) — Every fix gets a name and a single concrete step. Not "improve bathroom cleaning." Something like "retrain Maria's crew on shower checklist, Thursday."
-
Review last week's experiments (2 min) — Did the thing you tried last week move the number? Keep, kill, or adjust.
Thirty minutes, timer running. The discipline is in not solving problems during the meeting. You rank and assign. The actual fixing happens after.
Here's a quick visual of the weekly triage workflow.
The discipline is in not solving problems during the meeting. You rank and assign. The actual fixing happens after.
Priority scoring: impact × frequency
This is the core of the whole system, and it's simpler than it sounds.
Impact is how much damage one occurrence does. Client cancels? High. Client sends a slightly irritated text but rebooks? Low.
Frequency is how often the issue actually shows up across your jobs. A missed step that happens on one out of every twenty cleans scores very differently from a one-time mistake.
Score each on a 1–5 scale, multiply them, and you get a priority number from 1 to 25. Sort descending. Work from the top.
| Issue | Impact (1-5) | Frequency (1-5) | Priority Score |
|---|---|---|---|
| Bathroom showers rushed on 2nd-of-day jobs | 4 | 4 | 16 |
| Crew arriving outside window on Riverside route | 3 | 4 | 12 |
| Baseboards skipped on standard cleans | 2 | 5 | 10 |
| Wrong products used on stone countertops | 5 | 1 | 5 |
| Client's dog let outside by mistake | 5 | 1 | 5 |
Notice what this table exposes. The stone countertop mistake feels like the scariest one — highest impact, could ruin a surface. But it happened once and was a training gap that's already understood. Meanwhile, rushed showers on second-of-day jobs scores a 16 because it's both damaging and recurring. That's your real problem this week, even if it doesn't feel as dramatic.
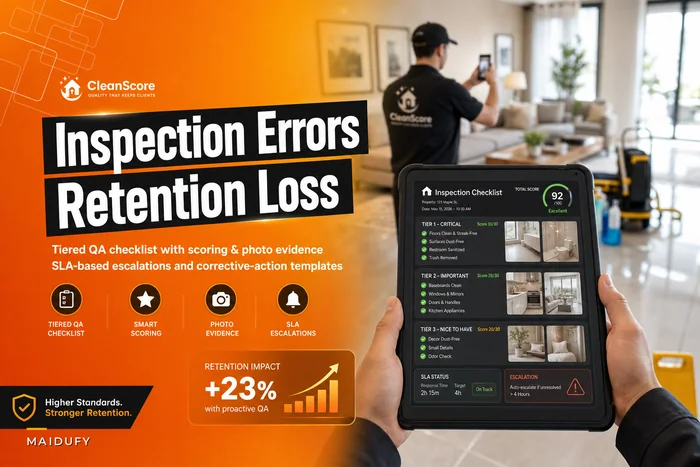
The scoring is what stops you from spending your whole week bracing against the rare catastrophe while the boring, high-frequency stuff quietly bleeds retention. If you've already built a scoring rubric for inspections, this layers right on top of the approach in the tiered QA checklist with scoring and photo evidence — the ops board is where those scores actually get acted on instead of filed.
A quick note on the frequency number
Don't guess frequency from memory. Memory over-weights whatever happened most recently. Pull it from actual counts. "This showed up on 6 of the 40 jobs we inspected" is a real frequency signal. "It feels like this happens a lot" is not. That one habit alone changes which issues rise to the top.
Sample ticket routing
Once an issue is scored, it needs to go somewhere specific. In small teams, the biggest routing failure is everything landing on the owner's desk — which means everything moves at the owner's speed, which is slow because they're also cleaning, quoting, and answering the phone.
-
Score 1–4 (low) Auto-logged, no action. Reviewed only if it repeats. Most one-off flukes live here and die here.
-
Score 5–9 (medium) Routed to the crew lead responsible for that route or client. Lead handles it directly — a quick retrain, a checklist reminder, a note to the cleaner.
-
Score 10–15 (high) Routed to the ops board. Gets an owner and a tracked action. This is your weekly fix list.
-
Score 16+ (critical) Same-day escalation. Doesn't wait for the weekly board. Owner or senior lead calls the client, addresses the crew, and it still gets logged for the board so you catch the pattern.
The point of routing by score is that low-value issues never consume high-value attention. A crew lead can clear five medium tickets in the time it takes an owner to read the complaint email. Push work down to the level that can actually handle it fast.
Escalation scripts that keep it low-drama
Escalation goes wrong when it turns into a blame conversation. The cleaner gets defensive, the lead gets frustrated, and the actual fix gets lost. Scripts help because they keep the conversation about the process, not the person.
Crew lead to cleaner (medium issue):
> "Hey, the Riverside job Tuesday came back with the shower flagged — looks like it got rushed. Was it a time thing or a checklist thing? Let's figure out what happened so it doesn't hit you again."
That "so it doesn't hit you again" framing matters. You're on their side against the problem.
Owner/lead to client (high or critical issue):
> "I saw the flag on your clean from Thursday and I wanted to reach out directly. That's not our standard and I've already talked with the crew about it. We'll re-clean the master bath at no charge this week — does Wednesday or Friday work better?"
No excuses, no over-explaining. Acknowledge, own it, offer a specific fix, give two options so the client picks instead of negotiating.
Board escalation (issue keeps recurring despite fixes):
> "This is the third week showers are flagging on second-of-day jobs. The retrains aren't holding, so it's not a knowledge gap — it's a scheduling or time-budget problem. We need to look at how much time we're allotting these jobs, not the cleaners."
That last one is the most important escalation to have written down. When a fix fails twice, the script forces you to stop blaming execution and start questioning the process. Repeated failure of the same fix is almost always a system problem wearing a people-problem costume.
Short experiments to confirm the fix worked
Assigning a fix isn't the same as solving the problem. This is where most ops boards quietly fail — issues get "fixed," everyone moves on, and the same complaint shows up three weeks later.
Run a small, time-boxed experiment on each top fix and check the number the following week.
Here's how a real experiment looks in practice. Say your top issue is rushed showers on second-of-day jobs, showing up on roughly 6 of every 40 inspected cleans.
-
Hypothesis Crews are running out of time on the second job, so they rush the bathroom.
-
Experiment For one week, add 15 minutes of buffer to every second-of-day job on the two worst routes.
-
What you measure Shower flags on those routes, next week's board.
-
Result to look for If flags drop meaningfully, the problem was time, not skill. If flags stay the same, it's a checklist or supervision issue and you retrain instead.
You're not committing to a permanent scheduling change. You're testing a guess for one week and letting the QA data tell you whether you guessed right. Most fixes fail because nobody checks — the experiment loop is what closes that gap.
A few experiment ideas that tend to work for small cleaning teams:
-
Add a photo-of-the-worst-room requirement on one route and watch whether flags drop (accountability effect)
-
Swap job order so the toughest home is first, not last, when crews are tired
-
Give one lead a 2-minute end-of-job checklist call-out and compare their flag rate to a route without it
-
Pair a struggling cleaner with a strong one for a week on a recurring problem area
The experiment loop is what closes that gap.
When this actually makes sense
The weekly ops board earns its place once you're past the point where you personally inspect every job. If you're a solo operator cleaning four homes a day, you are the QA system and a formal board is overhead you don't need yet.
It starts paying off when you've got multiple crews, you're relying on inspection reports or client feedback instead of your own eyes, and you've noticed the same complaints cycling back without ever getting resolved. That's the signal that data is piling up faster than it's getting triaged.
It also makes sense the moment you hire your first lead who handles quality. The board gives them a repeatable process instead of forcing them to develop judgment through expensive trial and error.
When it's a bad idea
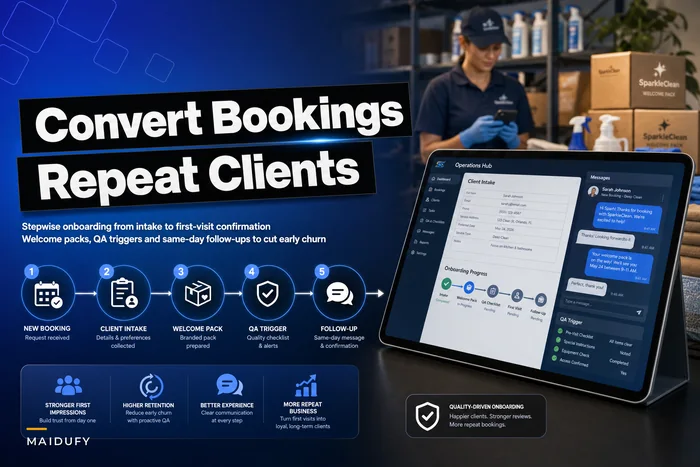
Skip it — or strip it way down — if your QA data is thin or unreliable. If you're only capturing a complaint when a client is angry enough to call, your frequency scores will be garbage and the board will just rank whoever complained loudest. Fix your data capture first. Getting consistent QA signal from inspections and post-clean check-ins comes before you can triage it usefully. The onboarding and QA-trigger setup in turning new bookings into repeat clients is the kind of upstream capture that feeds a board worth running.
Also skip the formal version if you and your one lead already talk through every issue daily and nothing slips. Don't add a meeting to solve a problem you don't have.
Who should NOT run this yet
If your quality problems are actually staffing problems — you're short-handed, cleaners are covering too many jobs, turnover is high — the ops board will just document the same issues over and over while you rank things you can't fix.
No amount of triage compensates for not having enough hands. Sort the capacity problem first, then the board becomes useful.
A real scenario
A residential cleaning company running around 330 jobs a month with four crews had a re-clean rate that was creeping up — roughly 1 in every 12 jobs getting a complaint or redo. The owner was fielding all of it personally, fixing whatever was loudest, and the numbers weren't budging.
They started a Monday ops board. First week, the scoring surfaced something the owner hadn't clocked: over half the flags were on second-of-day and third-of-day jobs, clustered in bathrooms and floors. Individually each complaint had looked random. Ranked by impact × frequency, the pattern was obvious — end-of-day fatigue and time compression, not bad cleaners.
They ran the buffer-time experiment for two weeks on the two worst routes. Re-cleans on those routes dropped to about half of what they'd been. They rolled the buffer out wider, adjusted a few quotes to cover the extra time, and the overall complaint rate settled to roughly 1 in 20 over the next couple of months.
Nothing exotic happened. The board just forced the owner to see the pattern, test one guess, and check the result — instead of reacting to complaints one at a time indefinitely.
Keeping the board running when you scale
The hand-logging works fine at four crews. Past that, pulling counts and sorting issues by hand every Monday gets old and things start slipping back into the inbox. This is where operational software that already captures inspection scores, complaint tags, and re-clean flags starts to matter — not because you need a fancy system, but because the board is only as good as the data feeding it, and manual pulls get skipped when you're busy.
Platforms that auto-tag QA issues by route and crew, and apply an impact × frequency score as tickets come in, basically pre-build your ranked list before Monday arrives. The manager walks into the board with the top issues already sorted and the routing already done. That turns a 30-minute meeting into a 15-minute one and removes the "I didn't have time to pull the numbers" excuse that kills most weekly reviews.
Run the board manually for a month before buying tooling so you know exactly which parts are worth automating.
But don't buy tooling to start. Run the board manually for a month first. Once you've felt where the manual work actually drags, you'll know exactly which parts are worth automating and which parts were never the bottleneck.
The habit is the whole point
The scoring method and the routing rules matter, but the real value is that the board happens every single week, same time, same agenda. QA data doesn't improve anything on its own — it's just evidence. The weekly triage is what turns evidence into a short, ranked, owned list of fixes, and the experiment loop is what proves the fixes worked before you move on.
Start Monday. Pull last week's flags, score them on impact × frequency, pick your top three, assign owners, and set a timer for 30 minutes. Next Monday, check whether the numbers moved. That loop, repeated, is worth more than any single big quality initiative you'll ever launch.
Start Monday. Pull last week's flags, score them on impact × frequency, pick your top three, assign owners, and set a timer for 30 minutes. Next Monday, check whether the numbers moved. That loop, repeated, is worth more than any single big quality initiative you'll ever launch.
Ready to elevate your cleaning business?
Join 500+ cleaning services using Maidufy to save time, reduce scheduling errors, and deliver exceptional client satisfaction.